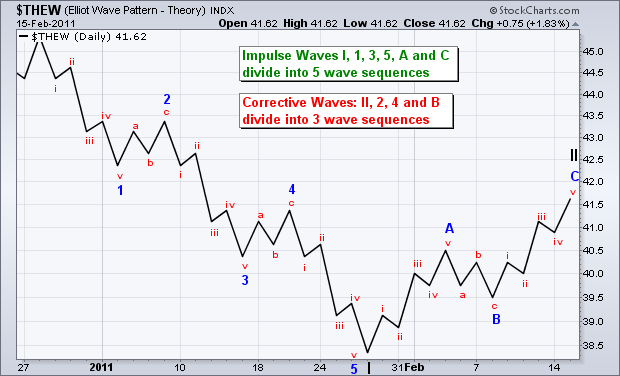
IFLM - ILST - Buy after an EW Decline Buy after an Elliott Wave, 5-Wave decline sequence ! Buy after an Elliott Wave 5-Wave Decline https://investorshub.advfn.com/boards/read_msg.aspx?message_id=133040947 https://investorshub.advfn.com/boards/read_msg.aspx?message_id=131958679 _________________________________________________________________ IFLM 0.0001 - BUY https://investorshub.advfn.com/boards/read_msg.aspx?message_id=133212563 IFLM Security Details Share Structure Market Value1............$58,587 a/o Jul 21, 2017 Authorized Shares..6,000,000,000 a/o Aug 23, 2016 Outstanding Shares...585,867,360 a/o Oct 14, 2016 Float................ 322,888,087 a/o Aug 23, 2016 Par Value 0.00001 ________________________________________________________________ ILST 0.0001 - BUY https://investorshub.advfn.com/boards/read_msg.aspx?message_id=133181817 ILST Security Details Share Structure Market Value1...........$167,261 a/o Jul 20, 2017 Authorized Shares..3,000,000,000 a/o Jul 17, 2017 Outstanding Shares 1,672,613,725 a/o Jul 17, 2017 Float.............. 1,529,786,219 a/o Jul 21, 2016 Par Value 0.001 ________________________________________________________________ Buy after an Elliott Wave, 5-Wave decline sequence ! Buy after an Elliott Wave 5-Wave Decline https://investorshub.advfn.com/boards/read_msg.aspx?message_id=131958679 A Basic "A,B,C Corrective Wave" https://www.metatrader5.com/en/terminal/help/objects/elliott/elliott_theory http://www.forexhit.com/learn-forex/elliott-wave-principle.html https://investorshub.advfn.com/uimage/uploads/2017/2/16/vvrclElliott_Wave_Decline_8_Wave.png https://investorshub.advfn.com/uimage/uploads/2017/5/24/bhbbwElliott_Wave_Chart.png https://www.stockscores.com/chart.asp?TickerSymbol=ILST&TimeRange=720&Interval=d&Volume=1&ChartType=OHLC&Stockscores=1&ChartWidth=830&ChartHeight=500&LogScale=None&Band=None&avgType1=SMA&movAvg1=8&avgType2=SMA&movAvg2=34&Indicator1=RSI&Indicator2=PPO&Indicator3=AccDist&Indicator4=MFI&endDate=&CompareWith=&entryPrice=&stopLossPrice= https://www.stockscores.com/chart.asp?TickerSymbol=IFLM&TimeRange=365&Interval=d&Volume=1&ChartType=OHLC&Stockscores=1&ChartWidth=830&ChartHeight=500&LogScale=None&Band=None&avgType1=SMA&movAvg1=8&avgType2=SMA&movAvg2=34&Indicator1=RSI&Indicator2=PPO&Indicator3=AccDist&Indicator4=MFI&endDate=&CompareWith=&entryPrice=&stopLossPrice=
 News
News  Market Data
  Discover