


Monday, June 26, 2017 12:29:11 PM
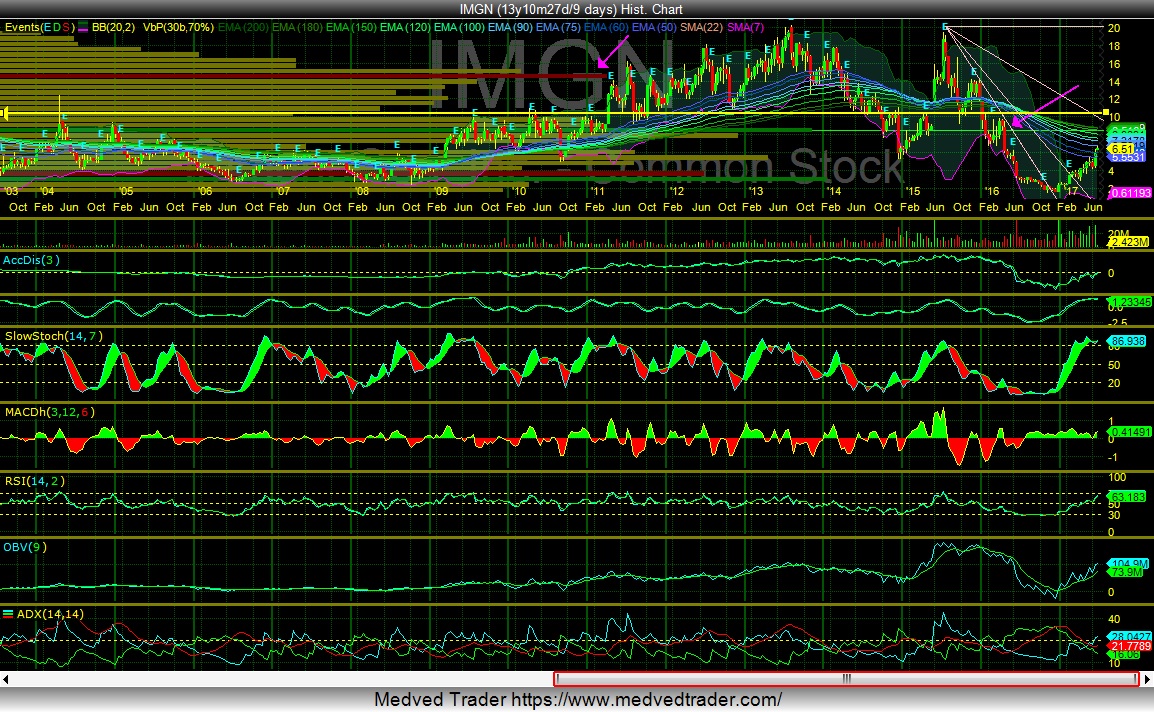
I use odd days instead of weeks and months to blend in the effect of paints and options expiration, etc.
Median LT VBP is about $7.21 we could slow then but I don't expect much.
The yellow line marks an area of weakening resistance over $10, often those areas become a line of defense.
Depending on the timing of fundamentals we could see a trading range take root in that range, or we could see a cup and handle form at that range and then a launch to $20 like we saw in 2015. I think the clarity of the forming cup and handle indicates that we will see one at either $7 or $10 and then a rapid launch.
I rarely use Fibonacci, but I see a significance in the concurrence with the $7 and $10 levels and the Fibonacci as confirmatory.
I would love to see some timeline comments from other posters more intimately acquainted with the science. I have followed this company for a long time and I know it is reaching maturity but I primarily trade on charts because buying a great company at the wrong time just sucks :)
In Peace, In War
Recent IMGN News
- Form 15-12G - Securities registration termination [Section 12(g)] • Edgar (US Regulatory) • 02/22/2024 09:15:19 PM
- Form SC 13G/A - Statement of acquisition of beneficial ownership by individuals: [Amend] • Edgar (US Regulatory) • 02/14/2024 10:01:40 PM
- Form SC 13G/A - Statement of acquisition of beneficial ownership by individuals: [Amend] • Edgar (US Regulatory) • 02/14/2024 09:26:22 PM
- Form 4 - Statement of changes in beneficial ownership of securities • Edgar (US Regulatory) • 02/12/2024 09:48:55 PM
- Form 4 - Statement of changes in beneficial ownership of securities • Edgar (US Regulatory) • 02/12/2024 09:48:14 PM
- Form 4 - Statement of changes in beneficial ownership of securities • Edgar (US Regulatory) • 02/12/2024 09:47:26 PM
- Form 4 - Statement of changes in beneficial ownership of securities • Edgar (US Regulatory) • 02/12/2024 09:46:37 PM
- Form 4 - Statement of changes in beneficial ownership of securities • Edgar (US Regulatory) • 02/12/2024 09:45:36 PM
- Form 4 - Statement of changes in beneficial ownership of securities • Edgar (US Regulatory) • 02/12/2024 09:44:41 PM
- Form 4 - Statement of changes in beneficial ownership of securities • Edgar (US Regulatory) • 02/12/2024 09:43:42 PM
- Form 4 - Statement of changes in beneficial ownership of securities • Edgar (US Regulatory) • 02/12/2024 09:42:43 PM
- Form 4 - Statement of changes in beneficial ownership of securities • Edgar (US Regulatory) • 02/12/2024 09:41:43 PM
- Form 4 - Statement of changes in beneficial ownership of securities • Edgar (US Regulatory) • 02/12/2024 09:41:07 PM
- Form 4 - Statement of changes in beneficial ownership of securities • Edgar (US Regulatory) • 02/12/2024 09:40:17 PM
- Form 4 - Statement of changes in beneficial ownership of securities • Edgar (US Regulatory) • 02/12/2024 09:39:18 PM
- Form 4 - Statement of changes in beneficial ownership of securities • Edgar (US Regulatory) • 02/12/2024 09:38:17 PM
- Form 4 - Statement of changes in beneficial ownership of securities • Edgar (US Regulatory) • 02/12/2024 09:37:39 PM
- Form 4 - Statement of changes in beneficial ownership of securities • Edgar (US Regulatory) • 02/12/2024 09:36:57 PM
- Form 4 - Statement of changes in beneficial ownership of securities • Edgar (US Regulatory) • 02/12/2024 09:35:42 PM
- Form S-8 POS - Securities to be offered to employees in employee benefit plans, post-effective amendments • Edgar (US Regulatory) • 02/12/2024 09:33:11 PM
Bantec Reports an Over 50 Percent Increase in Sales and Profits in Q1 2024 from Q1 2023 • BANT • Apr 25, 2024 10:00 AM
Cannabix's Breath Logix Alcohol Device Delivers Positive Impact to Private Monitoring Agency in Montana, USA • BLO • Apr 25, 2024 8:52 AM
Kona Gold Beverages, Inc. Announces Name Change to NuVibe, Inc. and Initiation of Ticker Symbol Application Process • KGKG • Apr 25, 2024 8:30 AM
Axis Technologies Group and Carbonis Forge Ahead with New Digital Carbon Credit Technology • AXTG • Apr 24, 2024 3:00 AM
North Bay Resources Announces Successful Equipment Test at Bishop Gold Mill, Inyo County, California • NBRI • Apr 23, 2024 9:41 AM
Epazz, Inc.: CryObo, Inc. solar Bitcoin operations will issue tokens • EPAZ • Apr 23, 2024 9:20 AM

