


Monday, June 19, 2017 10:00:08 AM
I want to start this discussion by saying all errors are my own. I will use two illustrations below, and particularly in the second illustration, I had to guesstimate one time point (median randomization), and interpret another (30%OS). Consequently, please do not rely on the data below as anything other than my best understanding.
Definitions:
PFS25% = Time point at which only 25% of enrollees from entire ITT population have not evented. Another way of stating this is 75% of patients have evented.
OS30% = Time point at which only 30% of enrollees from entire ITT population survive.
Discussion:
After NWBO made their enrollment ramp public, comparing some trial time points between the DCVax-L, ICT-107 and Rindopepimut trials seemed logical.
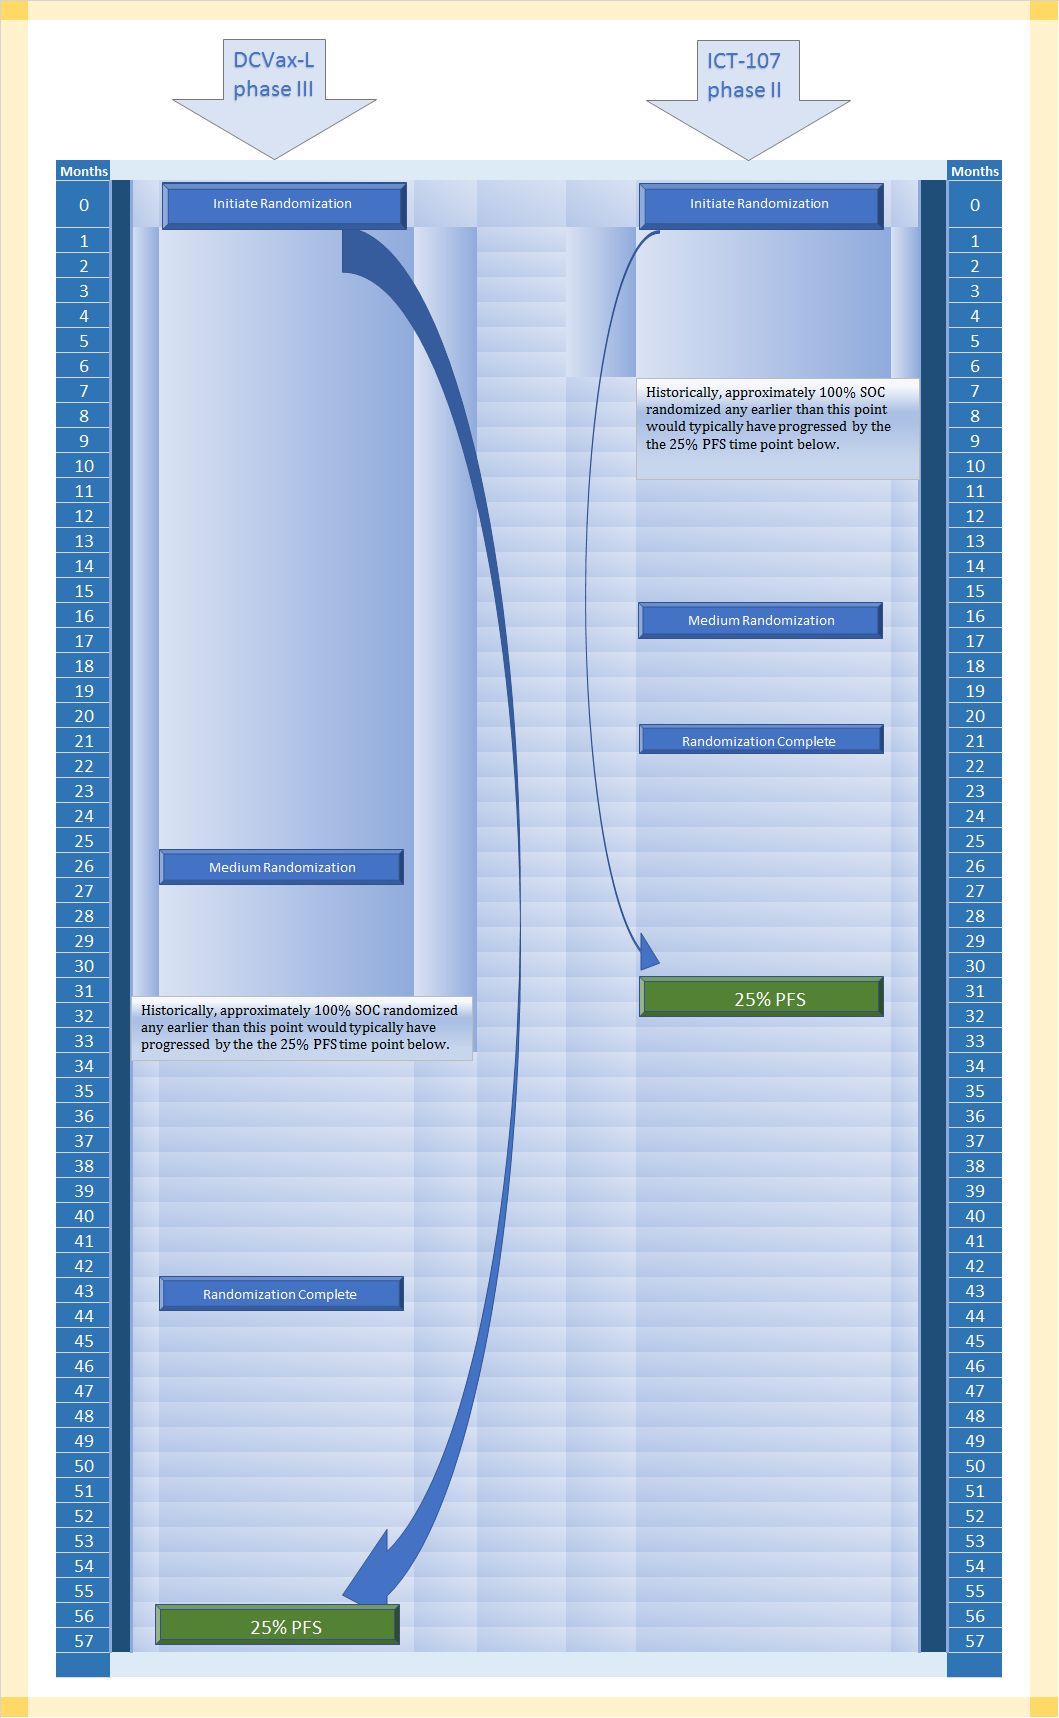
The first comparison is DCVax-L Phase III versus ICT-107. An approximation of these trial timelines can be found in the first of two illustrations below.
If many investors are like me, they might be predisposed to place great emphasis on the time from enrollment and/or randomization completion to the point at which interims or final data finally arrive. If you did that in the first illustration below, you might be surprised to find that would not remotely be a corrrect way to look at the available comparison data.
DCVax-L is 13 months from randomization completion to PFS25%, and ICT-107 is 10 months from randomization completion to 25%PFS. That probably does not strike anyone as a major difference, particularly when both trials had gone on for years.
However, look more broadly at the first illustration, and you will note that DCVax-L's trial took much longer to enroll/randomize. In fact, observe more closely and you will see that time from all trial randomization time points are further from PFS25% in months than all of the time points in ICT-107's trial are from its PFS25% time point.
Why does this matter? All that extra space in the DCVax-L trial represents more time that patients live progression free. Perhaps a creative visualization will help.
If you could squeeze the DCVax-L side of the trial enrollment randomizations to fit into the same time space as the ICT-107 trial timeline (otherwise imagining the exact same patients accounting for all events at PFS25%), there is only one place for that squeezed out time to go, and that is the space of time from enrollment completion to PFS25%. That distance would increase substantially. Its not a 1:1 correlation, because of the different rates of eventing at different times, but let me suggest that instead of the distance between randomization completion and PFS25% (aka: 75% have already evented) being 13 months, it might be one-and-a-half to twice as long, or 20.5 months to 26.5 months.
Consider that the ICT-107 trial had a median of 11 months median PFS blended. Another way of saying that 50% of patients evented by 11 months.
If DCVax-L is greatly extending time to PFS25% (as much as possibly doubling it), it is not a leap to suggest it is doing the same for PFS50%.
A critical question has already been asked, OK, so what? Perhaps NWBO has proved it has much better progression free survival in the overall ITT group than ICT-107 had, couldn't that still mean placebos and DCVax-L patients had the same mPFS in the DCVax-L trial?
That's true, but I would argue it is far less likely. Putting aside many other variables that might distract from the point I'm trying to make, there are two major advantages for the DCVax-L enrollees in the trial design compared to ICT-107. The DCVax-L enrollees had a higher percentage of complete resections and no biopsies, plus more DCVax-L enrollees had a higher starting absolute lymphocyte count (particularly in the first half of the trial). On the other hand, ICT-107 had one significant advantage, and that was they did not remove most long lived psPD and therefore did not remove many methylated MGMT.
It is up to the reader to determine if that is a draw in terms of advantages or not, but let me suggest if we assumed DCVax-L had 17 or more months mPFS (as compared to only 11 months PFS for ICT-107), it would be very difficult to believe SOC could go from what is normally about 6.7 months median PFS all the way to 17 months or more PFS without there being some efficacy impact from DCVax-L.
Moreover, if you look at the first illustration again, you'll note that that had both companies used standard of care with a typical patient population, DCVax-L would only be able to effect the last 23% of patients to even have any patients remaining at PFS25% whereas ICT-107 would be able to draw upon 77% of the patients remaining to have any patients remaining at PFS25%. In other words, it is quite easy to understand why there might not be a large separation between control and treatment at PFS25% in the ICT-107 trial, but it would be very unusual not to see large separation between control and DCVax-L at the same PFS25% point in the DCVax-L trial.
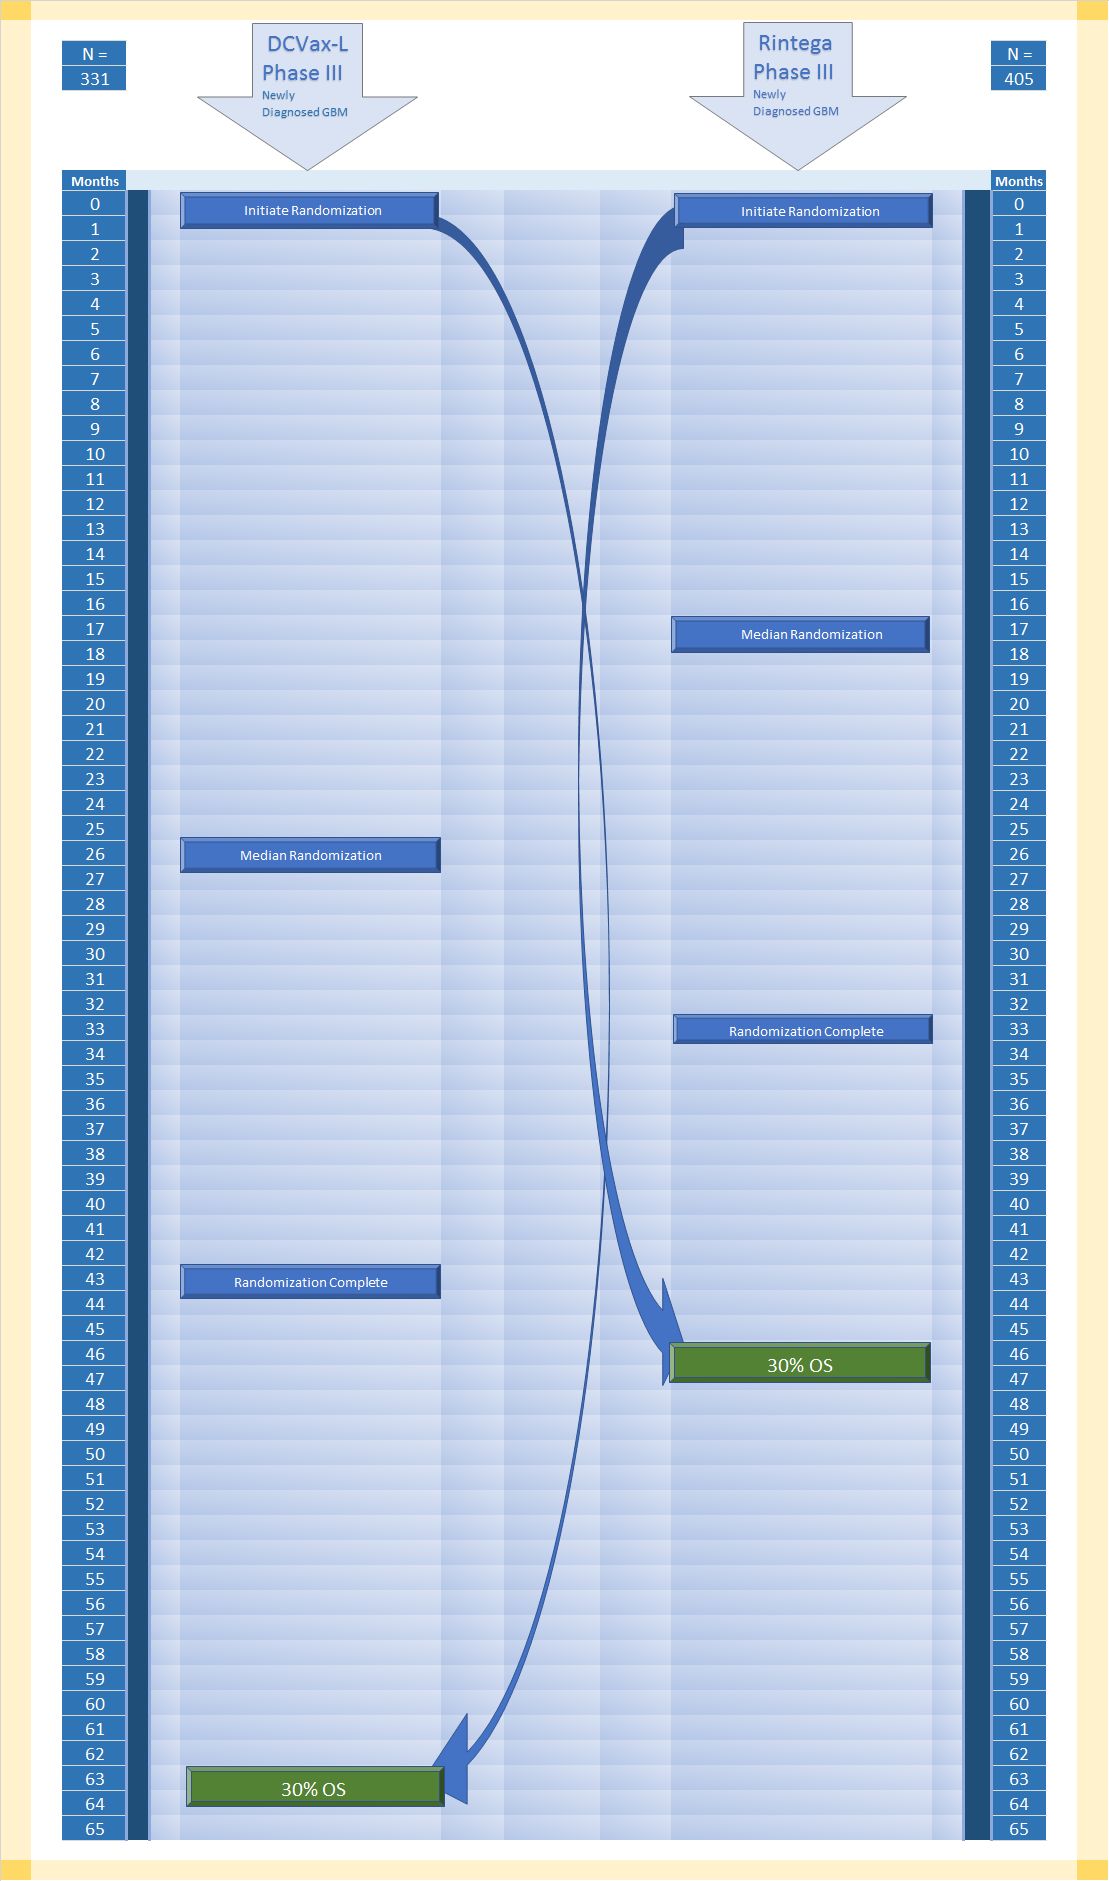
Basically, in the second illustration below, you can conduct similar observations. I would caution that I only guessed what the median randomization point was for the Rintega trial, and I am not completely certain although more confident now that I interpreted how to calculate 30%OS from the ITT population.
Again, if you creatively visualized condensing down the randomization times for the DCVax-L side to match the Rintega side, that time would have to go somewhere, and that would be the space between completed randomization and OS30%. Although the correlation would not necessarily be 1:1, it's possible the time could be twice that of the Rintega side.
We know from Dr. Bosch that OS eventing has now slowed to a crawl. That probably did not happen in the Rintega trial at 30%OS. Why do I say that? In real time, the two trials completed randomization only 10 months apart -- DCVax-L trial approximately November 1, 2015, while Rintega completed randomization about nine months earlier around February 2015, and yet from what I can tell, Rintega already conducted its final follow up analysis (post futility) around March of this year. If they did this at 379 events, that would mean only 7% enrollees survived by that time point.
If that is the case, there was no long tail to speak of in the Rintega Phase III trial.
Again, so what? From the rate at which Dr. Bosch states the DCVax-L trial is currently eventing, it would take about the same amount of time for the DCVax-L ITT population to reach 25% surviving enrollees. This means to me there is a long tail. The question, again for the reader is whether there is separation between control and treatment. Crossover confoundment might add to the the complexity of such an analysis, but imho there is little to no doubt the DCVax-L trial is showing efficacy.
The difference at the ends of the Rintega and DCVax-L trials appear to be stark. The theoretical reason would be that the Rintega trial allowed tumor escape more often and sooner than the DCVax-L trial. Unlike the ICT-107 trial, to me the only major advantage of the DCVax-L trial over the Rintega trial is the first half enrollment excluding lower absolute lymphocyte count, and the Rintega trial had the advantage of keeping long lived psPD. From my perspective, there is very little chance this cancels out much if any advantage the DCVax-L trial appears to be showing in longevity.
Respect Risk. Conduct Your Own Due Diligence. Manage your assets wisely. Diversify.
Recent NWBO News
- Form NT 10-K - Notification of inability to timely file Form 10-K 405, 10-K, 10-KSB 405, 10-KSB, 10-KT, or 10-KT405 • Edgar (US Regulatory) • 03/01/2024 10:04:38 PM
- Form 4 - Statement of changes in beneficial ownership of securities • Edgar (US Regulatory) • 12/02/2023 01:31:35 AM
- Form 8-K - Current report • Edgar (US Regulatory) • 11/16/2023 10:11:54 PM
- Epazz, Inc. (OTC Pink: EPAZ) ZenaDrone Demonstration to Defense Departments of UAE and Saudi Arabia • InvestorsHub NewsWire • 11/15/2023 12:19:31 PM
- Form 10-Q - Quarterly report [Sections 13 or 15(d)] • Edgar (US Regulatory) • 11/09/2023 09:30:39 PM
- Epazz, Inc. (OTC Pink: EPAZ) US Navy Collaboration ZenaDrone 1000 • InvestorsHub NewsWire • 11/09/2023 01:00:34 PM
- Epazz, Inc. (OTC Pink: EPAZ) US Navy Collaboration ZenaDrone 1000 Extreme Weather Demo • InvestorsHub NewsWire • 11/07/2023 12:29:43 PM
- Form 10-Q - Quarterly report [Sections 13 or 15(d)] • Edgar (US Regulatory) • 08/09/2023 08:36:14 PM
Bantec Engaged in a Letter of Intent to Acquire a Small New Jersey Based Manufacturing Company • BANT • May 1, 2024 10:00 AM
Cannabix Technologies to Deliver Breath Logix Alcohol Screening Device to Australia • BLO • Apr 30, 2024 8:53 AM
Hydromer, Inc. Reports Preliminary Unaudited Financial Results for First Quarter 2024 • HYDI • Apr 29, 2024 9:10 AM
Avant Technologies to Implement AI-Empowered, Zero Trust Architecture in Its Data Centers • AVAI • Apr 29, 2024 8:00 AM
Bantec Reports an Over 50 Percent Increase in Sales and Profits in Q1 2024 from Q1 2023 • BANT • Apr 25, 2024 10:00 AM
Cannabix's Breath Logix Alcohol Device Delivers Positive Impact to Private Monitoring Agency in Montana, USA • BLO • Apr 25, 2024 8:52 AM

