SPY Weekly Wrap -- Record Highs, Then Reversal By Carl Swenlin | June 10, 2017
Last week I wrote: ". . . the spike in S&P 500 New Highs makes me think that the market may be on the verge of another consolidation or correction that could last several weeks." I still think that outlook is viable, based upon this week's price action. The market formed a short flag the first four days of this week, and while price broke out of the trading range on Friday, the breakout failed and price actually broke down through the bottom of the trading range. Price finally settled back inside the trading range, but it makes one wonder if this was a blowoff setting up a correction? Let's look deeper into the technical condition of the market.
STOCKS
IT Trend Model: BUY as of 11/15/2016
LT Trend Model: BUY as of 4/1/2016
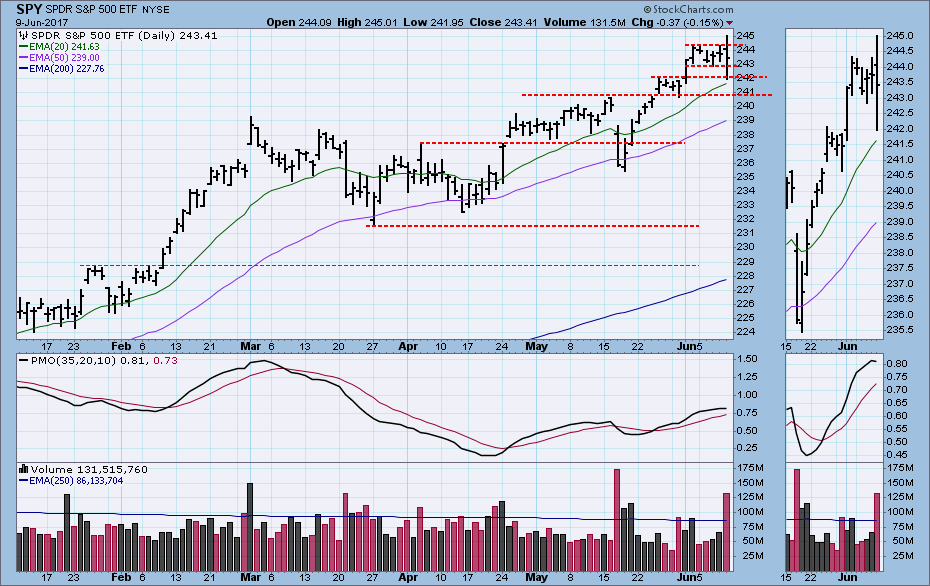
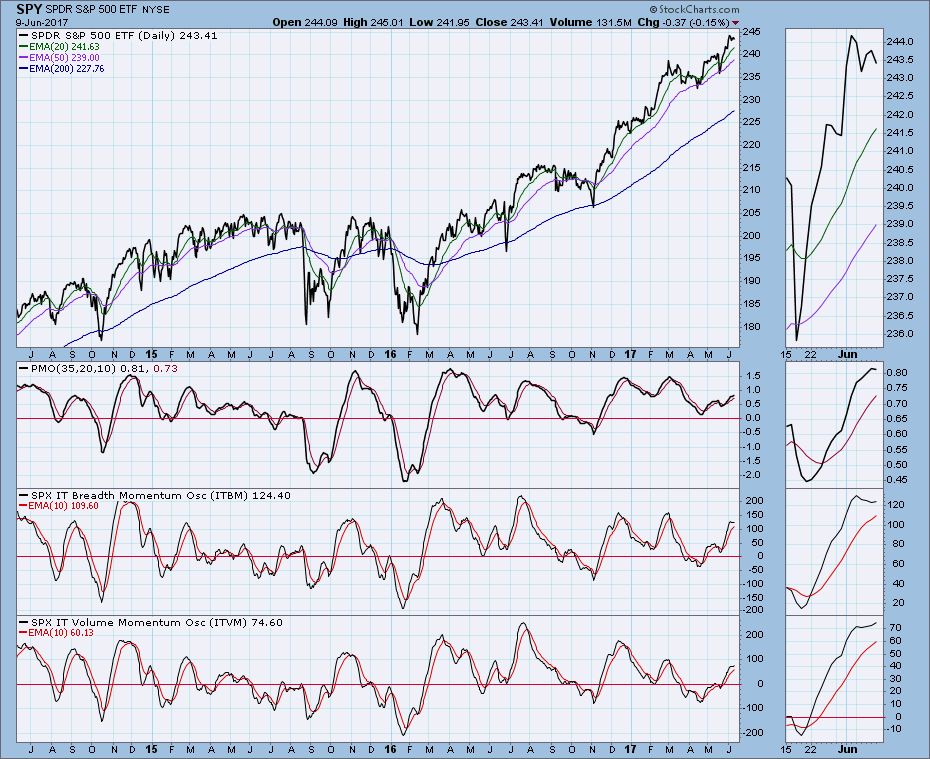
SPY made new, all-time highs intraday, but couldn't hold them. It also broke down through the bottom of the short-term trading range, but it couldn't get a selloff going either. The daily PMO topped, so their could be more weakness next week, but the PMO is not so overbought that it cries for correction.
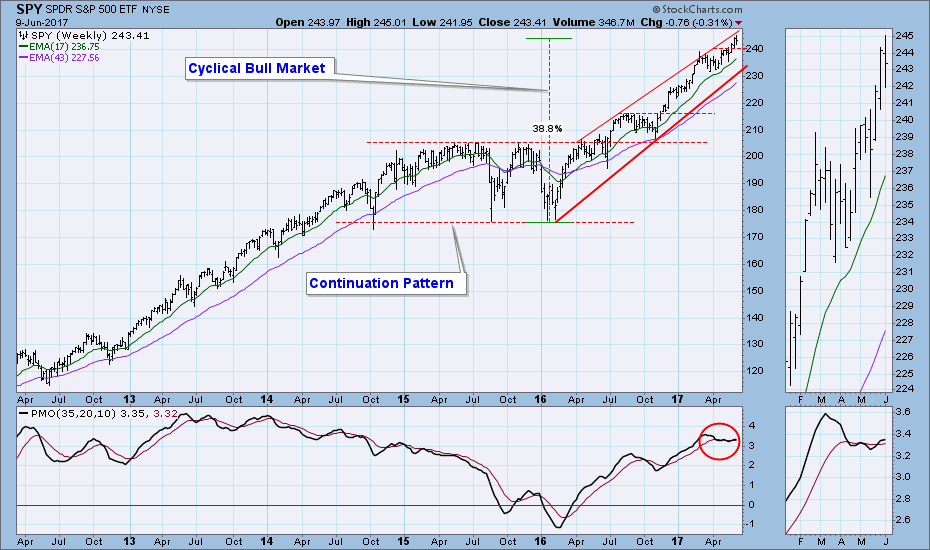
On the weekly chart SPY is hugging the top of a rising channel and it is well above the cyclical bull market rising trend line.
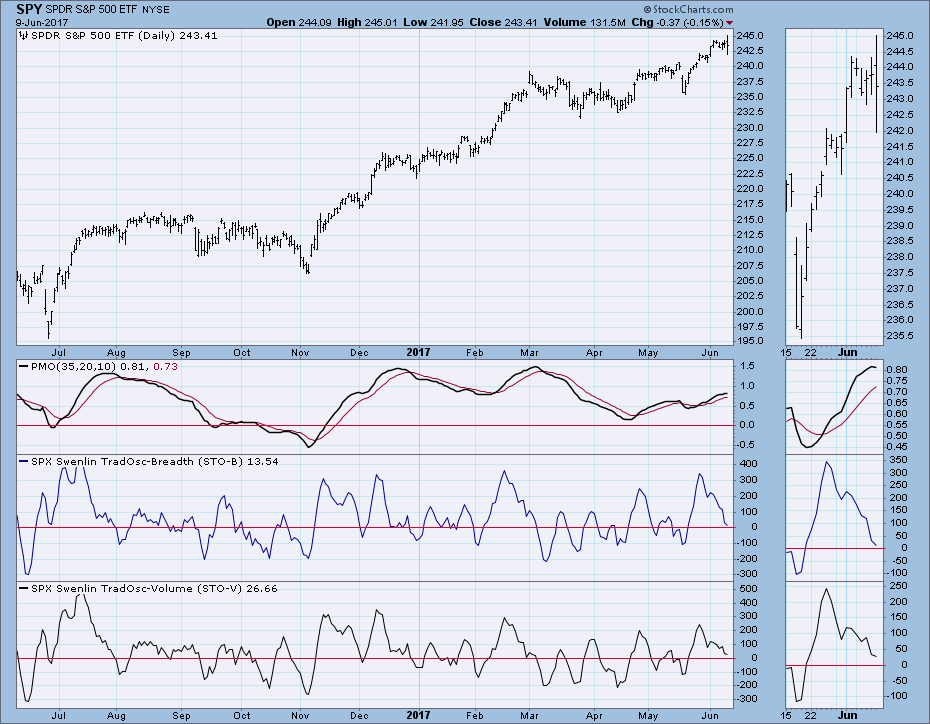
Short-Term Market Indicators: These indicators have fallen into the neutral zone, but they can accommodate continued price decline.
Intermediate-Term Market Indicators: The ITBM (breadth) and ITVM (volume) are rising, but just narrowly. Since the PMO has topped, they will fall if weakness persists.
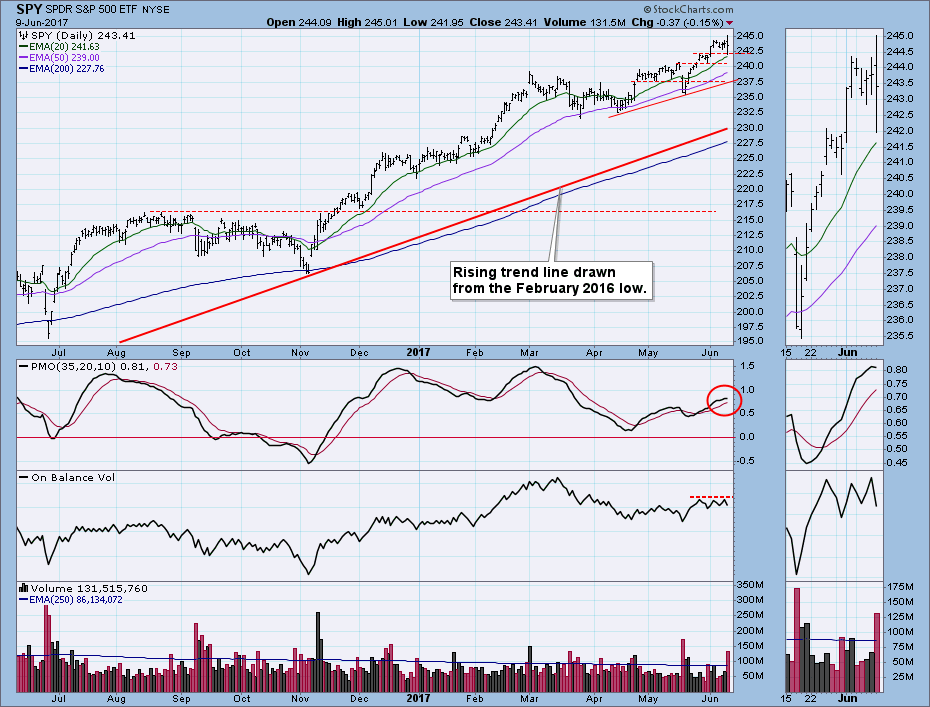
Conclusion: The overriding context is that we are in a cyclical bull market within a longer-term secular bull market. The cyclical bull started in February 2016, and a textbook guestimate of when it will finally top would be August 2018. This is based upon the two-and-a-half year template for cyclical bull markets, but it is only a rule-of-thumb. As I wrote last week, I think the market may be on the verge of another correction or consolidation that could last several weeks. That outlook still stands. Price is well above the 200EMA and primary trend line, and the market needs to bleed off some of that excess. Now would be a nice time for that to happen, but the fact is that this condition has existed since February. . .
Information posted to this board is not meant to suggest any specific action, but to point out the technical signs that can help our readers make their own specific decisions. Your Due Dilegence is a must! • DiscoverGold
Register for free to join our community of investors and share your ideas. You will also get access to streaming quotes, interactive charts, trades, portfolio, live options flow and more tools.


 News
News  Market Data
  Discover