:) Nasdaq 100 Versus 2000 Dot Com Peak By Bespoke | June 7, 2017
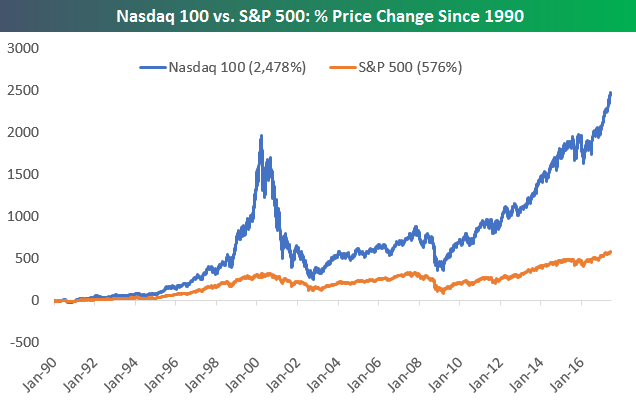
The Tech-heavy Nasdaq 100 is up more than 20% year-to-date, and as shown in the chart below, the index is now 24.8% above its Dot Com bubble peak hit on March 27th, 2000. In the mid to late 2000s, there were plenty of investors that thought they wouldn’t live to see the Nasdaq take out its Tech-bubble highs, but the index’s surge over the last year has made it a reality.
While the Nasdaq 100’s chart looks pretty gorgeous right now, we can’t help but wonder when the next downturn will come. Remember, stocks do go down sometimes!
Since 1990, the Nasdaq 100 is up nearly 5x as much as the S&P 500 in terms of simple price appreciation. Talk about outperformance.
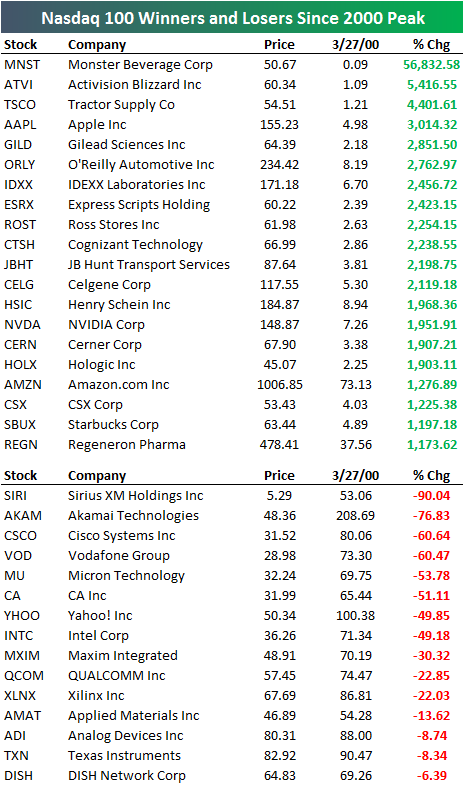
Below is a look at the best and worst performers in the Nasdaq 100 (current members) since the Dot Com peak on March 27th, 2000. One fifth of the index is up more than 1,000% since those prior highs, including names like Apple (AAPL), NVIDIA (NVDA), Amazon.com (AMZN), and Starbucks (SBUX).
Even more interesting to us is that 15 stocks in the index still haven’t taken out their Dot Com bubble highs. Stocks like Cisco (CSCO), Yahoo! (YHOO), and Intel (INTC) are all still 50%+ below their 3/27/00 price levels.
Information posted to this board is not meant to suggest any specific action, but to point out the technical signs that can help our readers make their own specific decisions. Your Due Dilegence is a must! • DiscoverGold
Register for free to join our community of investors and share your ideas. You will also get access to streaming quotes, interactive charts, trades, portfolio, live options flow and more tools.


 News
News  Market Data
  Discover