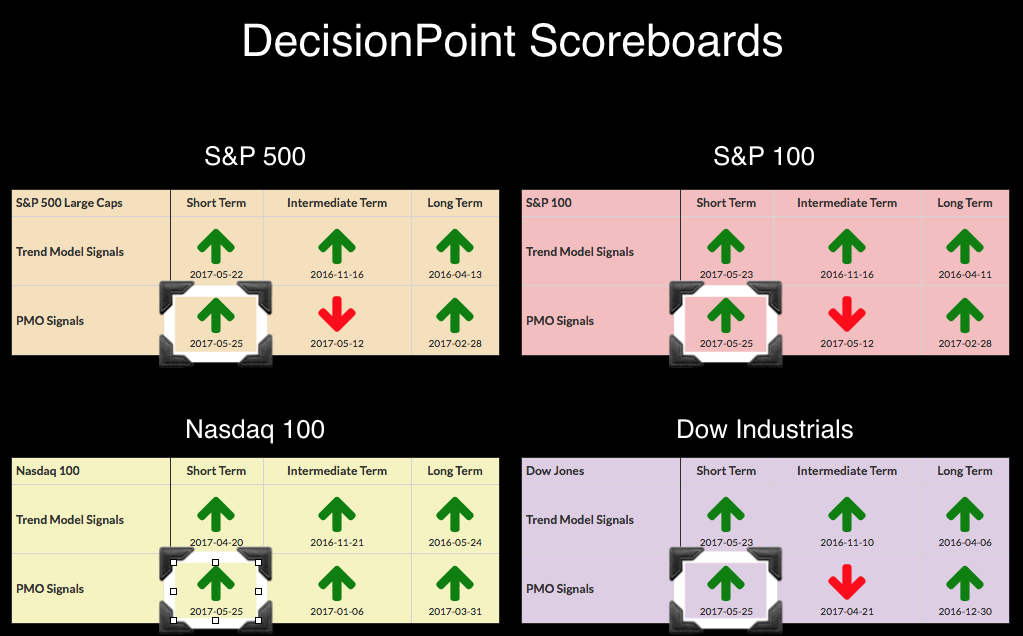
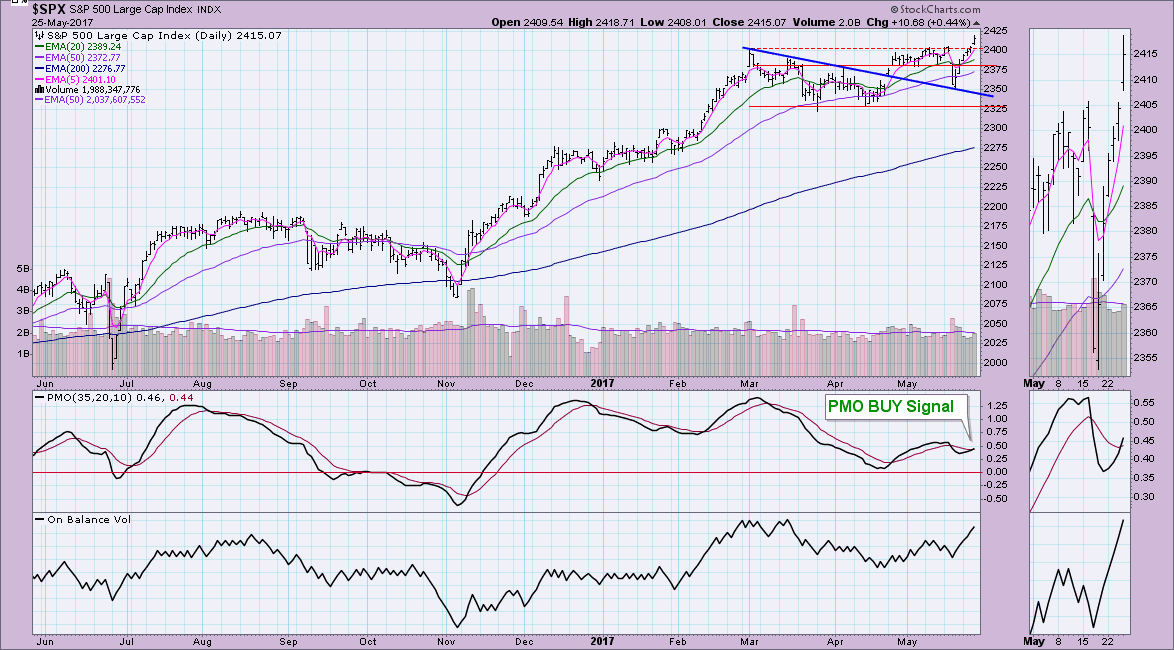
::: New PMO BUY Signals on All Four Scoreboards Too Late? By Erin Heim | May 25, 2017
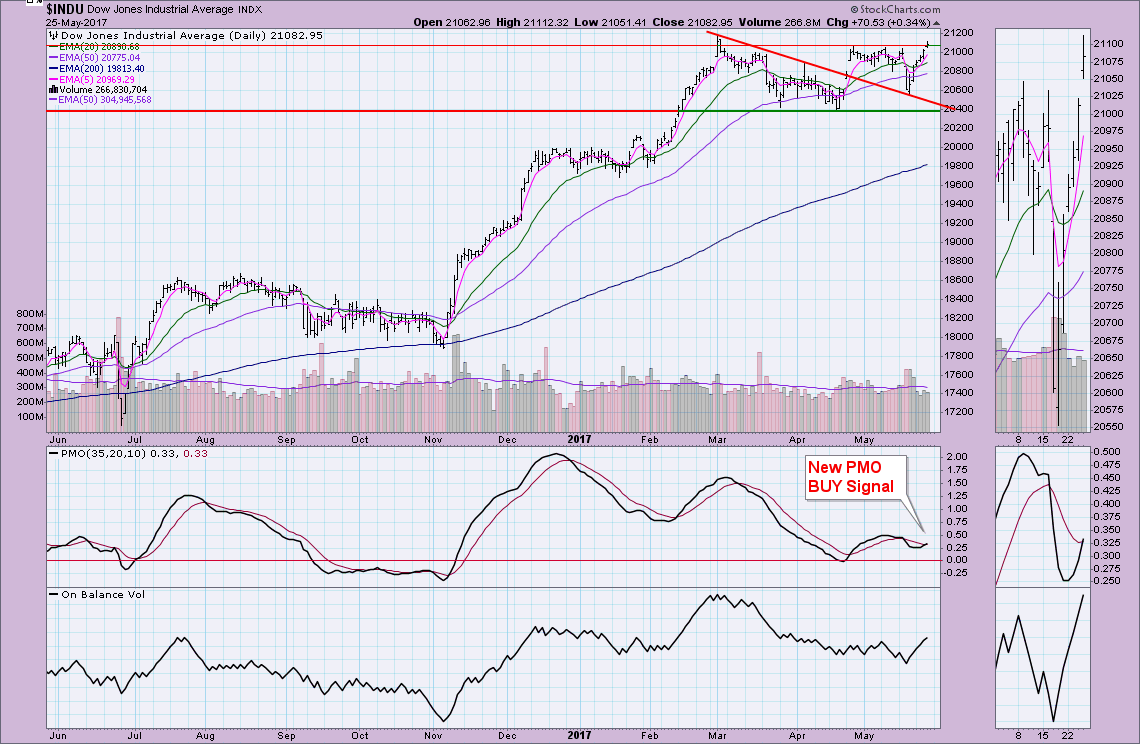
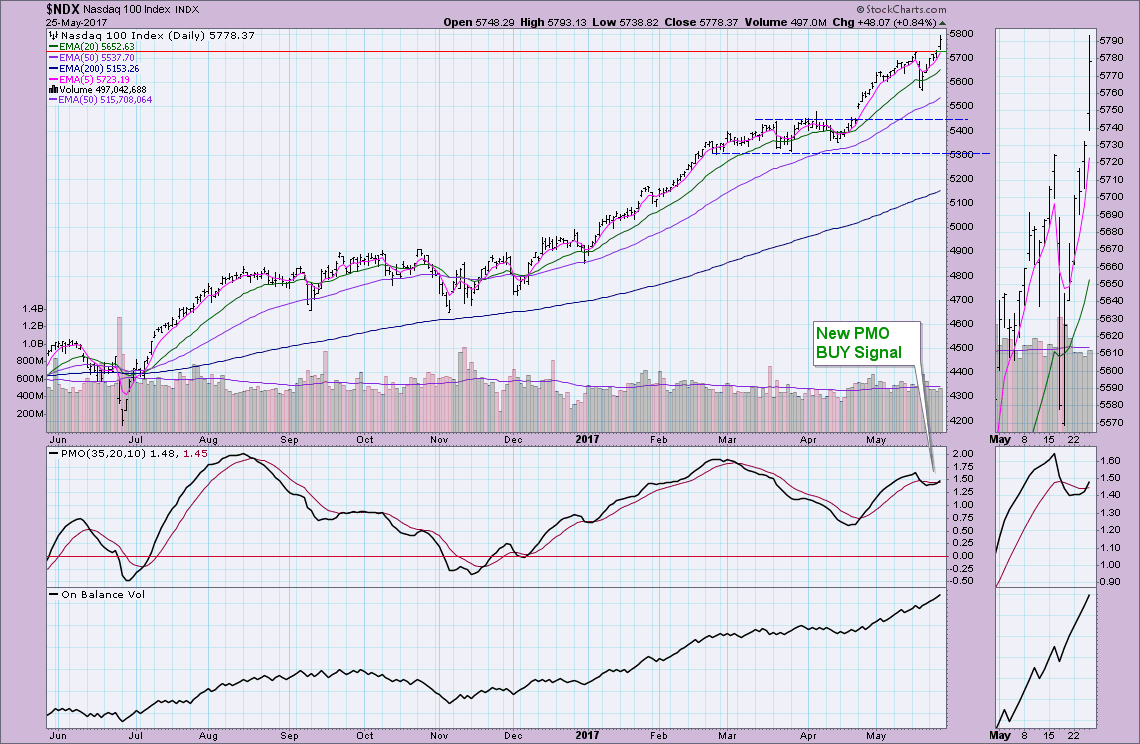
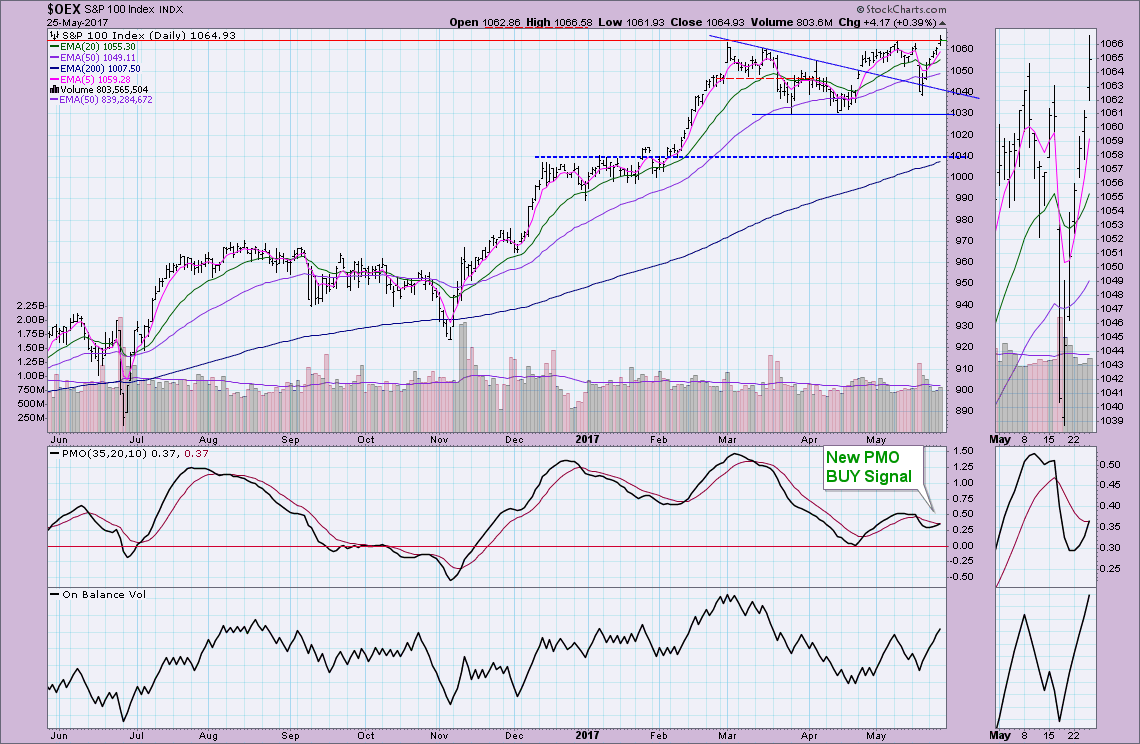
As noted in the DP Scoreboard Summary below, all four major indexes triggered PMO BUY Signals today as the PMO crossed above its signal line. This certainly confirms the ST Trend Model BUY signals that appeared after yesterday's strong rally. You'll note in their charts below that all made new intraday all-time highs. These breakouts above overhead resistance are impressive and do suggest we could see continued follow-through. Remember you can reach these charts anytime in the DP shared ChartList. The link is at the top of our blog.
STOCKS
IT Trend Model: BUY as of 11/15/2016
LT Trend Model: BUY as of 4/1/2016
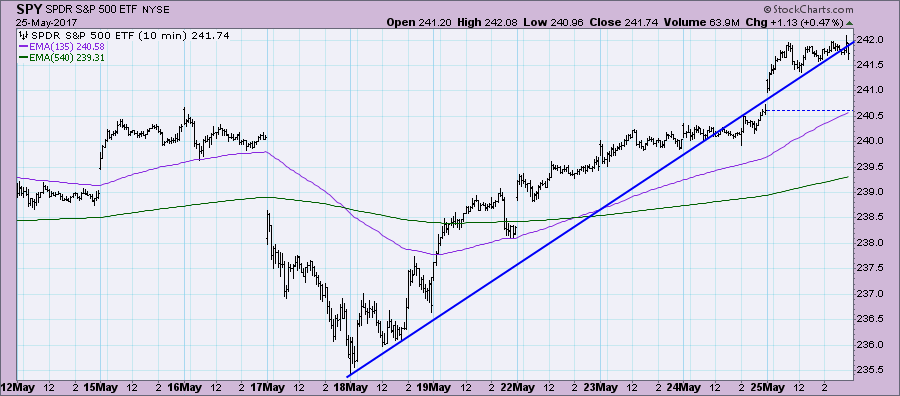
The 10-minute bar chart reflects consolidation after the breakout to new all-time highs.
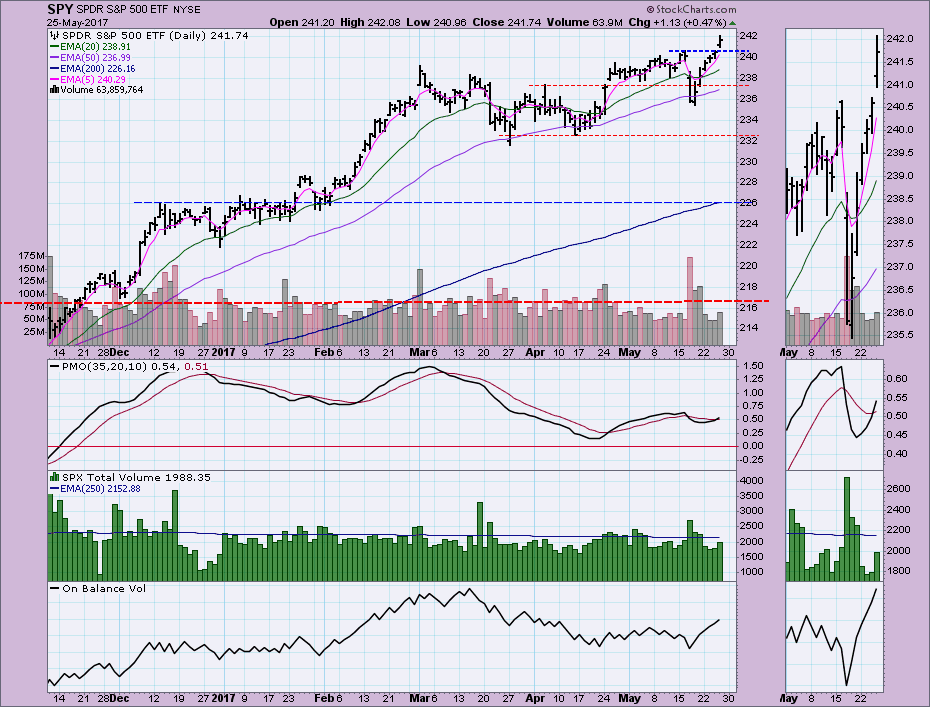
Trading completely above resistance at all-time highs, the SPY pulled the PMO above its signal line to trigger a BUY signal on the SPY. The breakout occurred on slightly higher volume than yesterday, but it was below average. I have concerns that price will hold above this new area of support and one reason is that less than impressive volume pattern.
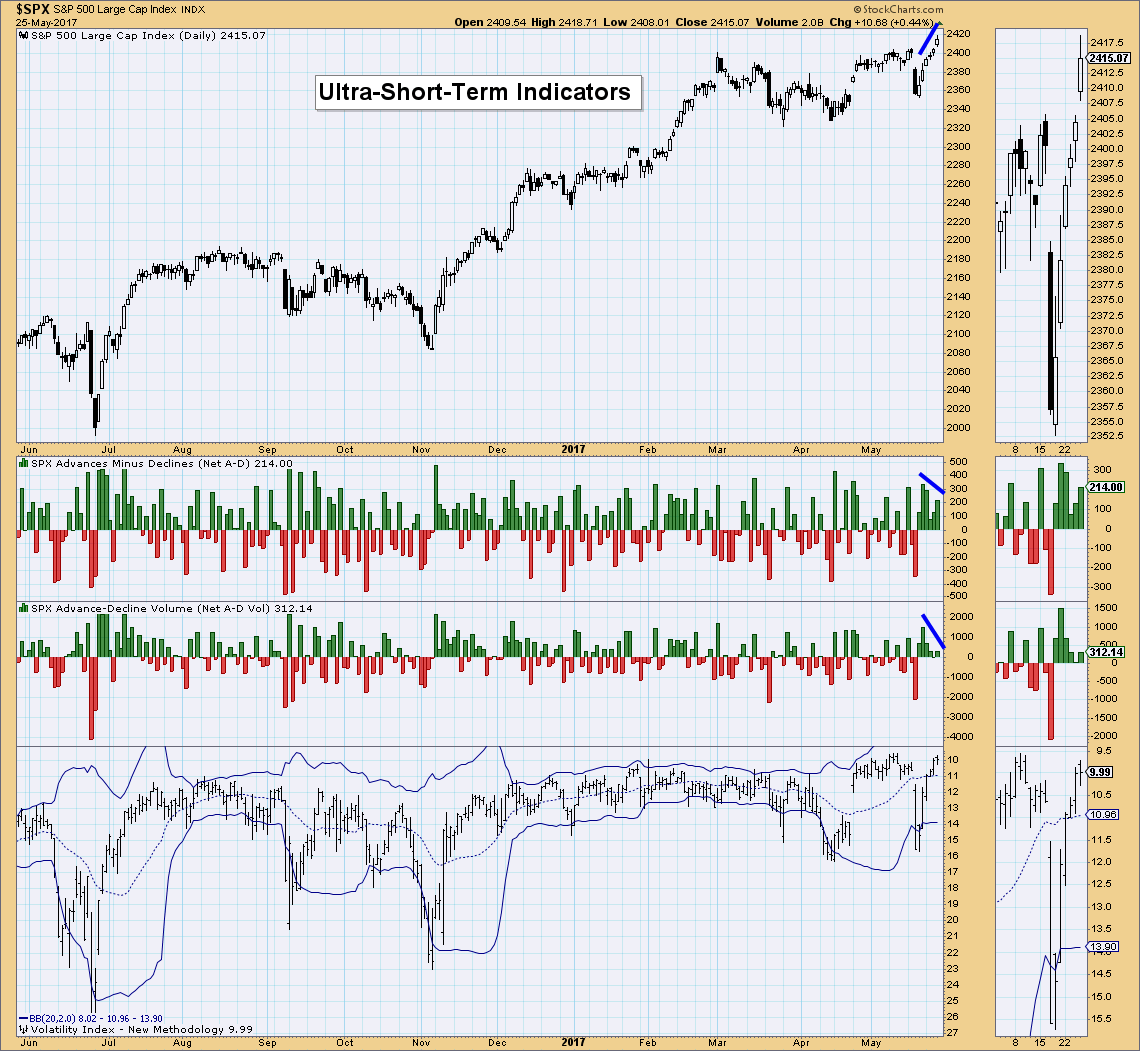
Ultra-Short-Term Indicators: Another concern are the negative divergences on breadth. This is pretty ugly folks. The VIX is above average on the inverted scale which suggests bullish complacency. That's very dangerous if their isn't volume to support the continuation of a rally.
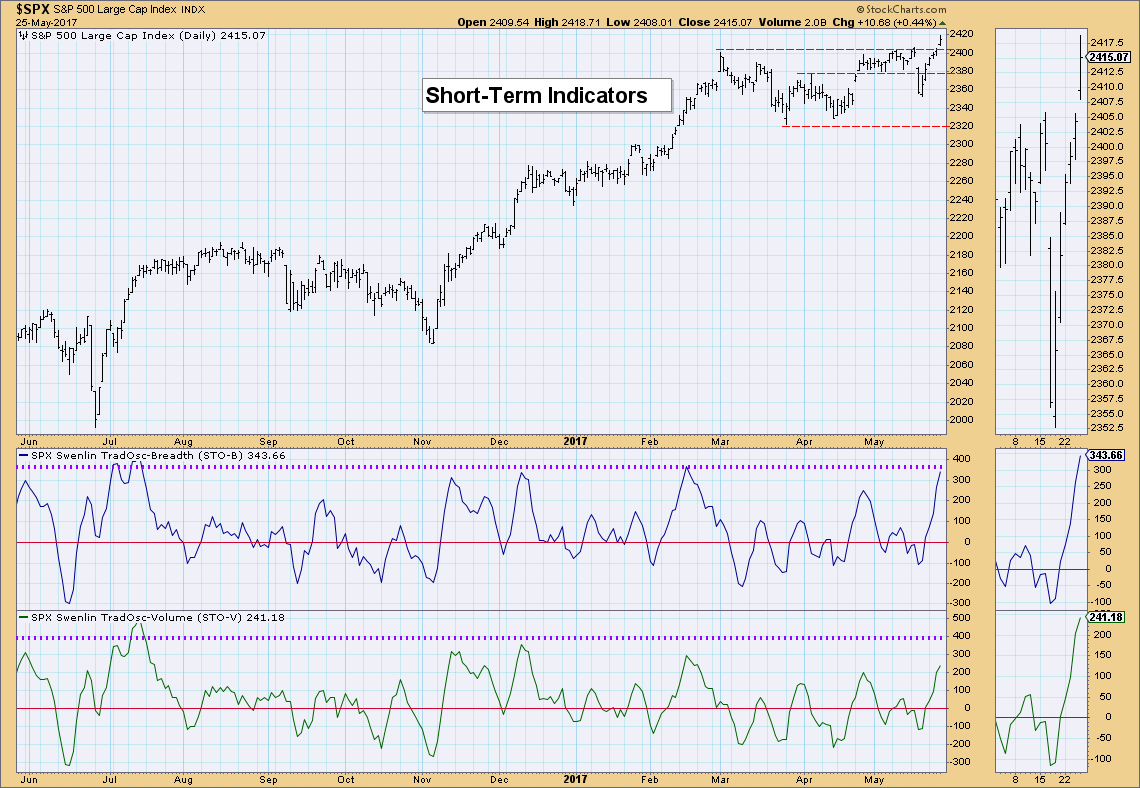
Short-Term Indicators: These indicators are rising very strongly which is generally bullish, but they are now very overbought. How do these indicators typically decompress? They relieve overbought conditions typically with a price decline; however, you'll note that the last top moved lower as price consolidated sideways.
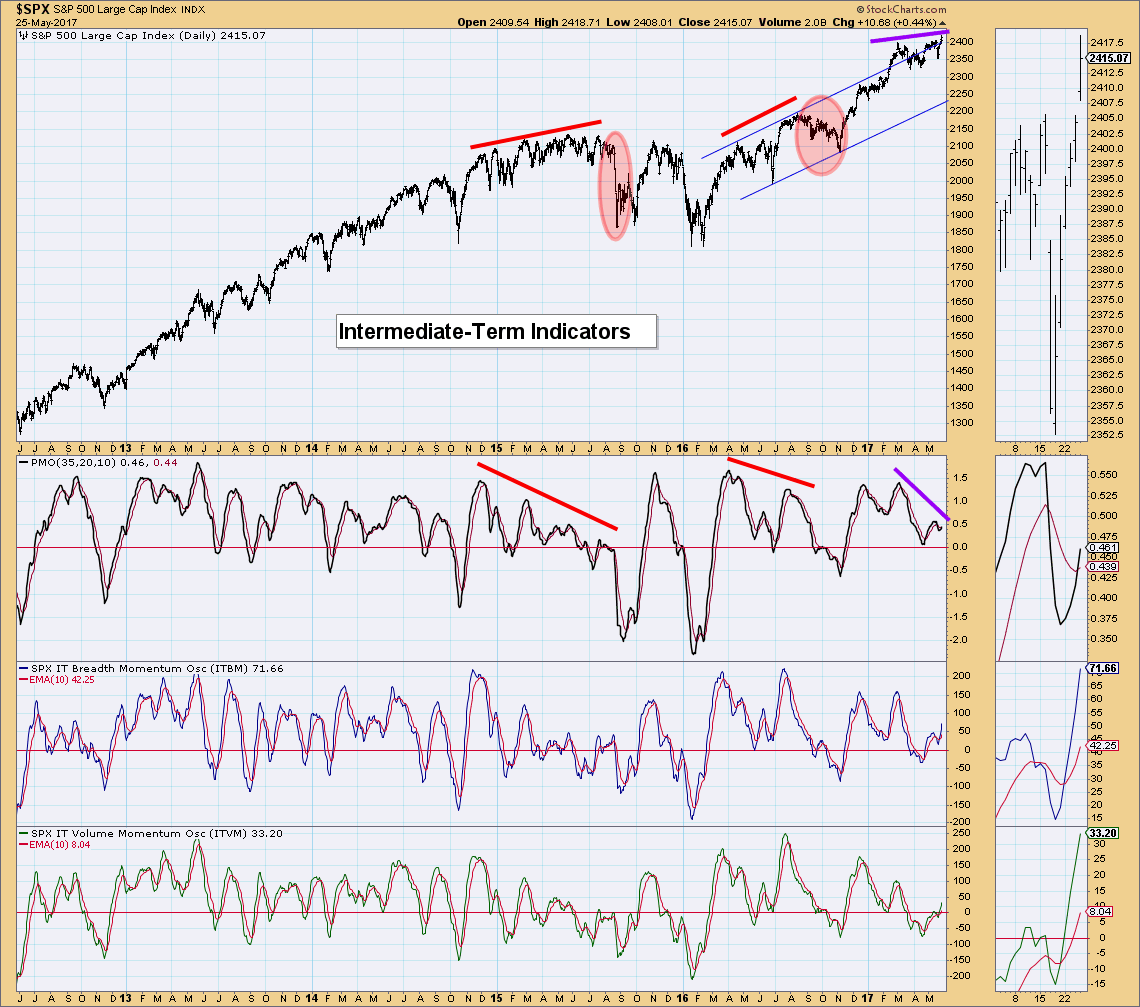
Intermediate-Term Indicators: These indicators are mixed. The ITBM and ITVM are rising nicely after positive crossovers their signal lines. That's very bullish since they are in positive yet neutral territory. There's plenty of room for them to climb higher. My concern is the current PMO negative divergence marked in purple. Note what previous negative divergences portended.
Conclusion: There certainly could be some follow-through on this rally given the new PMO BUY signals across the board. However, volume patterns and PMO negative divergences suggest a near-term pullback or drop.
Click on "In reply to", for Authors past commentaries
Information posted to this board is not meant to suggest any specific action, but to point out the technical signs that can help our readers make their own specific decisions. Your Due Dilegence is a must! • DiscoverGold
Register for free to join our community of investors and share your ideas. You will also get access to streaming quotes, interactive charts, trades, portfolio, live options flow and more tools.


 News
News  Market Data
  Discover