After Wednesday’s Rout In Stocks, Bounce Possible, But VIX Yet To Flash One By Hedgopia | May 18, 2017
Wednesday’s rout in stocks is a reminder that when stretched too far a rubber band will snap. And when that happens, it will do so with plenty of energy.
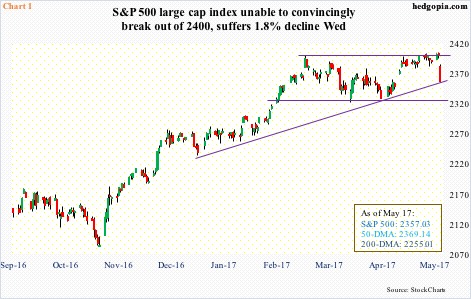
The S&P 500 large cap index has not had a one-percent drop since March 21 – essentially sideways since March 1 when it hit 2400.98. The index tried to break out several times, all unsuccessfully. The latest attempt was made on Monday when it rose intraday to 2405.77 but closed the session in the red. Tuesday, it collapsed 1.8 percent.
Nothing too serious so far.
The S&P 500 is still up 5.3 percent for the year, and up 10.2 percent post-election last November. What matters is if investors are now in the initial stages of repricing or even pricing out President Trump’s economic agenda, including tax cuts and massive infrastructure spending.
We know this much. There was no ‘buy the dip’ this time around. Buyers were simply overwhelmed by the sellers. The 50-day moving average has been lost. Volume was at a two-month high.
Importantly, the index remains overbought on both weekly and monthly chart. The last time it corrected five percent was in October last year. It has not had a 10-percent sell-off since February last year. Thus, it is entirely possible unwinding of overbought conditions continues.
For now, the index closed Wednesday on a rising four-and-a-half-month trend line (Chart 1), which also approximates the lower daily Bollinger band. Thirty points lower, there is another near-term support. Bulls need to defend these levels in order to avoid unraveling.
Worse, it drops to 2280, which is where a rising trend line from February last year rests.
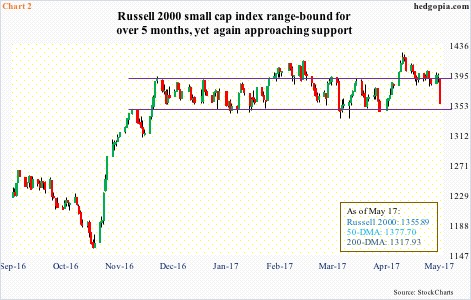
On the Russell 2000 small cap index, this trend line is not tested until 1320, which is about where its 200-day moving average lies. A must-save. But before that lies months-long range support.
The index has stayed trapped within 1390s and 1340s for over five months now, with a couple of false breakouts (Chart 2). During all this, small-cap bulls have defended support. A convincing loss of that support potentially signals which way things are likely to trend next.
The bulls do not want to see this. The range support is defended but this is followed by another wave of selling at the 50-day. The average is flat to slightly declining.
On the S&P 500, too, the 50-day is flattish.
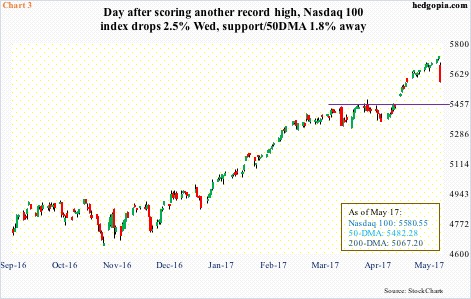
The Nasdaq 100 index has been the one with a lot of oomph. It has not lost its 50-day in the last five months. Even after Wednesday’s 2.5-percent drop, the average is still 1.8 percent away. This is also where its near-term support lies (Chart 3).
As is the case with the other two indices, the Nasdaq 100 is overbought on both weekly and monthly basis, with lots of potential unwinding left. The medium- to long-term outlook does not favor the bulls. Near-term, how things transpire near support likely holds the key.
As things stand, on Wednesday 43.3 percent of Nasdaq stocks were above their 50-day moving average – oversold enough for a bounce but not a durable bottom. Just before the election last November, this metric dropped to 22.8 percent, and 8.2 percent in January last year.
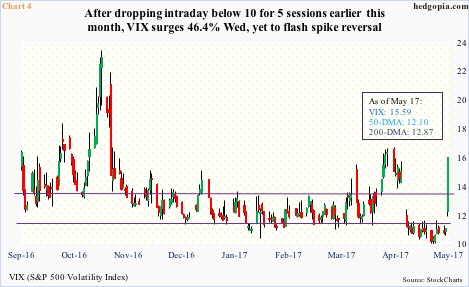
Near term, the best place to look for signs of a bounce in equities remains VIX. Wednesday, it rallied 46.4 percent to 15.59 – past both its 50- and 200-day. This, however, was not enough to surpass the April 17th high of 16.28 (Chart 4).
As well, the VIX-to-VXV ratio closed Wednesday at parity – overbought enough it can begin to unwind (not shown here). For that, VIX needs to reverse. In the past, spike reversals in VIX have proven to be decent trading opportunities. It has not flashed one yet. Wednesday’s candle was solid white, closing near session highs.
Information posted to this board is not meant to suggest any specific action, but to point out the technical signs that can help our readers make their own specific decisions. Your Due Dilegence is a must! • DiscoverGold
Register for free to join our community of investors and share your ideas. You will also get access to streaming quotes, interactive charts, trades, portfolio, live options flow and more tools.


 News
News  Market Data
  Discover