


Wednesday, May 10, 2017 9:16:20 AM
The conventional TA is all near-term negative and offering positives only by taking contrarian positions - everything is oversold, we made a new low, volume is reducing so it must be at a bottom and reversing now. As we know, this doesn't always (often?) work out well.
My unconventional stuff is beginning to turn less negative, although it's still a long way from positive or even neutral.
In aggregate I do believe (Again? Really?) that the end of the leg lower is near if signs of ATM use disappear. We haven't seen that condition but once over the last week or so. Today we did see what I though was a reset of price higher after a period I was strongly suspecting had ATM sales occurring. My first thought was price was too low to make continued ATM use worthwhile and they pushed it back up so they could resume those sales. Thank my TFH for that one. However, the buy percentage did improve marginally so the metrics don't support that thought as strongly as I would like in order to be more strongly suspicious.
We had what appears visually to be one of our common patters - open high, drop, recover a small amount, go flat for a long while, make a few-minute recover of all the loss, give back about half the recovery and go flat into the close. All this with a lot of very or extremely low volume with the usual widely-spaced minute, or a few minutes, spikes as the privileged few get serviced by the MMs. We closed at $0.657, 7/10ths of a cent above the day's low, after leading into the close at 15:58 with a $0.6635 price.
There were no pre-market trades.
B/a just before open was 100:8.2K $0.6601/$0.6950
09:30-09:52 opened the day with a 2,024 buy for $0.69 & $0.67 x 4, $0.6701 x 1.6K. B/a just after open was 2.9K:6.7K $0.67/9. Then came 9:31's 500 $0.67, 9:32's 300 $0.67, 9:32's b/a 2.8K:11.5K $0.67/9, 9:33's 200 $0.67, 9:34's 300 $0.67, 9:35's 600 $0.67, 9:36's 900 $0.67, 9:37's 600 $0.67, 9:38's 500 $0.67/$0.6605/10, 9:39's 910 $0.6611/10/02/04, 9:40's 1.7K $0.6602/1 (1.6K), 9:41's b/a 3.6K:5.4K $0.6601/95, 9:41's 100 $0.6601, 9:42's 350 $0.6694/01, 9:43's 500 $0.6691, 9:44's 2.1K $0.6601/3 (350)/1, 9:45's 900 $0.6601/2/1, 9:46's 3.1K $0.6601/0 (2.2K), 9:47's 8.5K $0.66, 9:48's 500 $0.66, 9:49's 6.9K $0.66, 9:50's 300 $0.66, 9:51's b/a 4.7K:3.5K $0.6600/39 (offers falling rapidly), 9:51's 2.4K $0.66, the period ended on 9:52's 1.8K $0.66.
09:53-10:11 began highly variable-volume $0.6550/$0.66, with slowly falling highs, on 9:53's 2K $0.66/$0.6550 (400). B/a at 9:58 was 2.8K:200 $0.6550/$0.66 (offers falling), 10:02 2.9K:900 $0.6550/95 (offers falling). The period ended on 10:11's 400 $0.6550.
10:12-10:41 began highly variable-volume $0.6500/62, with falling highs, on 10:12's 4K $0.6550/00 (3.7K). B/a at 10:13 was 19.5K:6.8K $0.6500/49 (offers falling). 10:23's 2.1K hit $0.6510/3 and 10:29 began $0.6500/2. B/a at 10:32 was 900:3.5K $0.6500/2, 10:40 365:2.9K $0.6500/1. The period ended on 10:41's 500 $0.65.
10:42-11:04 began an extremely low/no-volume slow climb up after 10:42's 14.5K $0.6500/01/00 .../12 (6.4K)/02 (2K). 10:49's 300 hit $0.6556/99. Trading then began extremely low/no-volume $0.6513/95 with slowly falling highs. B/a at 10:53 was 7.5K:200 $0.6513/93. The period ended on 11:04's 400 $0.6513/50/87.
11:05-11:21 began a relatively rapid extremely low/no-volume move up on 11:05's 2.6K $0.6516/27 (2K). 11:09 hit $0.66 and the rest of the period was spent walking the low up. The period ended on 11:21s 300 $0.6596/71/96.
11:22-12:13 began a short extremely low-volume decline, before settling into a long sideways move, on 11:22's 200 $0.6569/7. The bottom was hit on 11:25's 2.3K $0.6540/63/40/54/40/54 and that began extremely low/no-volume $0.6513/95 with falling highs. B/a at 11:32 was 4.5K:2K $0.6513/73 (offers falling), 11:47 3.2K:4K $0.6513/74 (offers falling), 12:03 1.5K:3K $0.6513/64. The period ended on 12:13's 300 $0.6501/49.
12:14-12:28, after the initial six no-trades minutes with b/a at 12:15 of 400:3.2K $0.6501/99, began a rapid, relatively high-volume push higher, on 12:20's 2K $0.6575. The 12:22's 5K did $0.6574, 12:23's 100 $0.6599, 12:25's 300 $0.6599/50/$0.66, 12:26's 10K $0.6551 (2K)/53 (1.2K)/50 (1.9K)/53/50, and the period ended on 12:28's 15.9K $0.67 (3K)/$0.69 (3K)/$0.67 (2.9K)/$0.6850/$0.69/$0.6850/$0.67/$0.6850 (2.7K)/$0.67/$0.68/$0.67/$0.6850/$0.67/$0.6850/$0.67.
12:29-16:00, after two no-trades minutes, began extremely low/no-volume $0.655/$0.67, through 14:36, on 12:31's 300 $0.67. B/a at 12:34 was 10.3K:9.7K $0.6550/$0.67, 13:03 10.3K:200 $0.6550/$0.67, 13:17 10.5K:200 $0.6550/$0.67, 13:33 10.3K:1.7K $0.6550/$0.67. Volume was interrupted by 13:35's 15K $0.6550 (6.6K)/51 (4.7K)/53 (2.2K)/50 (1.3K)/51/$0.67. B/a at 13:47 was 3.6K:1.5K $0.6550/$0.67, 14:04 3.6K:1.2K $0.6550/$0.67, 14:17 700:700 $0.6551/$0.67, 14:32 800:300 $0.6551/$0.67. At 14:37 the lows began creeping up. B/a at 14:47 was 5.3K:200 $0.6570/$0.67, 15:02 5.3K:200 $0.6570/$0.67, 15:18 5.5K:800 $0.6570/$0.67, 15:34 6.1K:200 $0.6570/$0.67, 15:53 5.2K:200 $0.6570/$0.67. The period and day ended on 15:59's 10.3K $0.6635/$0.67/$0.6699 (1K)/$0.66 (3.8K)/$0.657 (1.8K)/$0.66 (3.1K) and 16:00's sells of 273 & 56 for $0.6570.
There were no AH trades.
Excluding the opening and closing trades (didn't qualify), there were 9 larger trades (>=5K & 1 4K+) totaling 54,900, 18.49% of day's volume, with a $0.6541 VWAP. For the day's volume the count seems a bit shy or what I would think normal, as is the percentage of the day's trade volume. The VWAP is below the day's $0.6573. Looking at where the trades occurred and buy percentage movements in those periods I suspect most were MMs and/or shorters doing covering buys. Of course, could be some traders and/or retail investors mixed in.
As with yesterday, a period below warrants attention, accounting for 25.86% of day's volume in just 30 minutes and also having the lowest VWAP and a pretty low buy percentage (but then what period didn't have a low buy percentage!). That 10:41 period also had most of the larger trades' volume.
The first couple hours, through 12:15, looked like we might have had some ATM activity going on, based on the VWAP and buy percentage combination. Subsequently it's hard to judge although I noted on stocktwits that there was a push up in price and I thought it was so ATM at a higher price could could continue. Since the buy percentage improved only marginally while the VWAP moved up noticeably, I suspect ATM use was occurring.Ending Period Period Period __Per. Trade_ Period_ % Day_ Per. End
Period Volume Low High _Dollar Val._ VWAP___ Volume Buy ~%
09:52 37734 $0.6600 $0.6900 $25,020.65 $0.6631 12.71% 5.74% Incl 09:47 $0.6600 5,700 09:49 6,500
10:11 31200 $0.6550 $0.6600 $20,515.24 $0.6575 10.51% 30.30%
10:41 76775 $0.6500 $0.6562 $49,951.71 $0.6506 25.86% 21.89% Incl 10:26 $0.6500 5,000 5,400 9,600
11:04 21157 $0.6500 $0.6599 $13,778.10 $0.6512 7.12% 21.87% Incl 10:42 $0.6512 6,400
11:21 8597 $0.6516 $0.6600 $5,630.58 $0.6549 2.90% 21.64%
12:13 25780 $0.6501 $0.6595 $16,838.05 $0.6531 8.68% 22.82%
12:28 33265 $0.6550 $0.6900 $22,197.26 $0.6673 11.20% 24.86% Incl 12:22 $0.6574 5,000
16:00 59329 $0.6550 $0.6700 $39,211.48 $0.6609 19.98% 27.31% Incl 13:35 $0.6550 6,600 $0.6551 4,700
On the traditional TA front, movements were:
As with yesterday, { ... This does not bode well. It does continue the recent trend though. }__Open_ ___Low_ __High_ _Close_ Volume_
Today -2.82% -1.52% -2.82% -1.35% -48.33%
Prior 2.94% -1.79% -0.53% -2.06% 36.53%
On my minimal chart we continued the trend of trading below the short-term descending resistance (descending orange line) but now with our high withdrawing from the descending line, traded completely below the former $0.70 support, and continued "pushing" the lower experimental 13-period Bollinger band limit for the eighth consecutive day. Trading range was again completely, and substantially (high ~3 cents), below the falling mid-point, $0.7214.
Both the fast and slow EMAs continue to decline with the fast below the slow. The gap from the slow down to the fast is now $0.0476 (was $0.0457).
Yesterday I said { If I were to stop my analysis right here, my best guess would be we have more downside left, although I think it would be minimal and we would enter a short consolidation based somewhere around that $0.66, plus or minus a bit. } So far that looks correct - we traded lower but the low was down only a penny, $0.66 to $0.65. If it is to remain correct we have to no begin a period of the low holding in around the current level, resulting in either a sideways move or beginning a reversal.
The falling volume, although still a bit high, offers this possibility. It's really iffy though and I wouldn't bet my chips on it yet.
On my one-year chart, for the eighth consecutive day, trading range was completely below all SMAs, all of which are falling with them all in order, 10 < 20 < 50 < 200.
Yesterday the oscillators I watch had weakening in accumulation/distribution, RSI (entered oversold), MFI (just above oversold - untrusted by me), momentum, Williams %R (still deeply oversold), full stochastic (still deeply oversold), and ADX-related. Nothing is above neutral.
Today had improvement only in momentum and Williams %R (still deeply oversold). Weakening occurred in everything else. Everything is below neutral and everything but MFI (untrusted by me) that has an oversold demarcation is oversold.
The experimental 13-period Bollinger limits, $0.6451 and $0.7978 ($0.6604 and $0.7983 yesterday), continued diverging as both limits declined, the lower faster than the upper. The mid-point is falling.
All in, only the reducing trade volume and oversold oscillators offer a suggestion that we may be at the bottom and ready to consolidate or reverse. The volume is not all that low though, relatively, and I suspect another day or two of further falling volume will be needed.
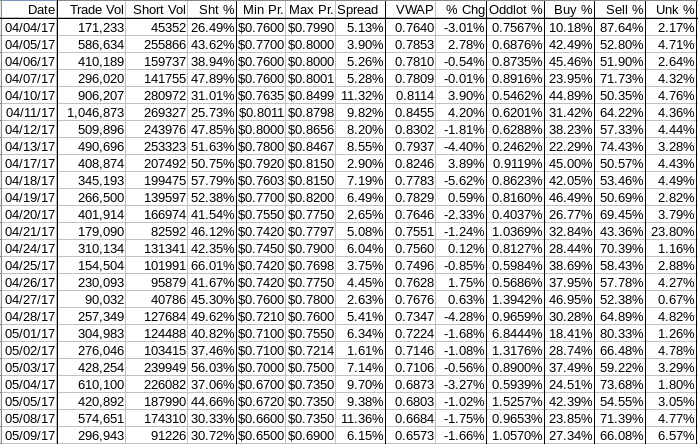
Percentages for daily short sales and buys moved ... Well, let's call short percentage flat. Buy percentage rose marginally and is still in a range suggesting more near-term weakness, or at least no strengthening in price. With the short percentage still below my desired range (needs re-check) I don't see any suggestion of near-term strengthening.
The spread finally stopped widening and began to contract. It's still wide enough to suggest more near-term movement though and, being in a down trend, would suggest more weakening. The degree of weakening could begin to reduce though.
The VWAP's rolling average of the last twenty-four movements, held steady for the second consecutive day at 16 negatives and 8 positives. Change since 04/04 is -$0.1067, -13.97%, and the averages of the rolling 24-day period seen in the last few days (latest first) are now -0.5928%, -0.6491%, -0.4703%, -0.5319%, -0.4198%, -0.2739%, -0.1888%, -0.1311%, 0.1088%, and 0.0842%.
All in, my unconventional stuff is migrating to a stance less negative than the conventional TA currently is suggesting. Nothings positive by any means yet but the narrowing spread, static short percentage and marginally improved buy percentage combined with reducing trade volume suggest a reduction in near-term weakening.
Bill
Join the InvestorsHub Community
Register for free to join our community of investors and share your ideas. You will also get access to streaming quotes, interactive charts, trades, portfolio, live options flow and more tools.

