DP Alert: New Signals on DP Scoreboards - Market Follows-Through on Rally By Erin Heim | April 25, 2017
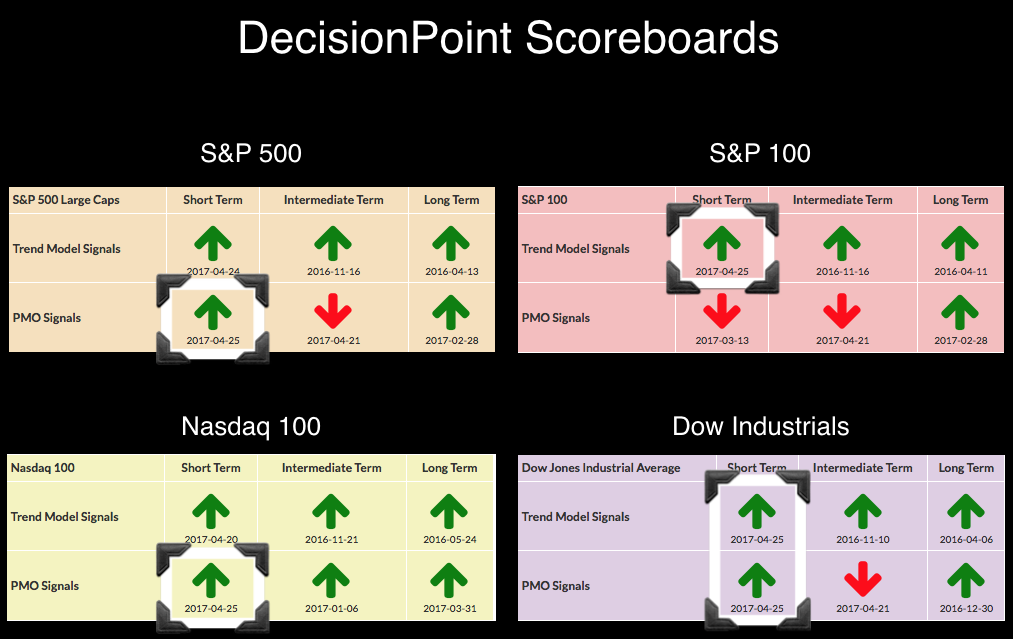
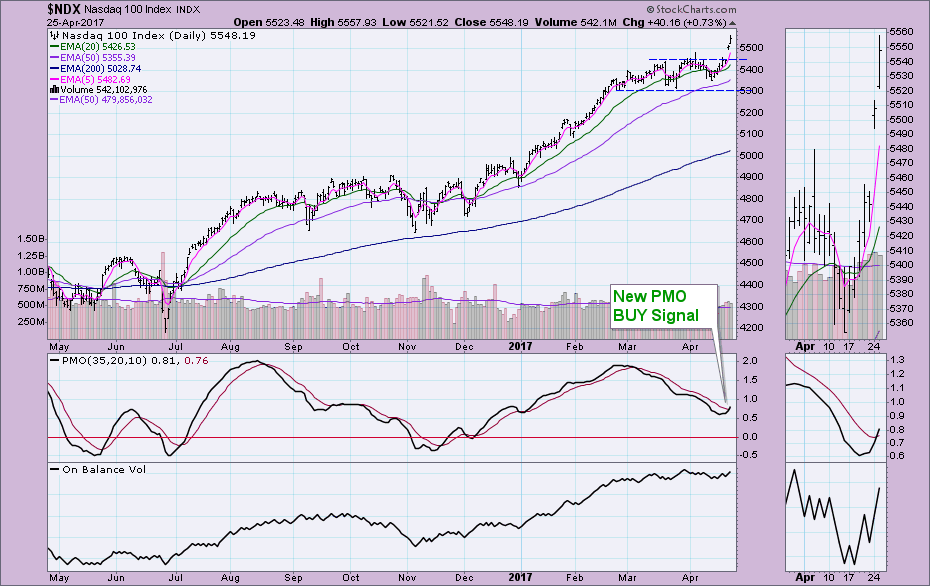
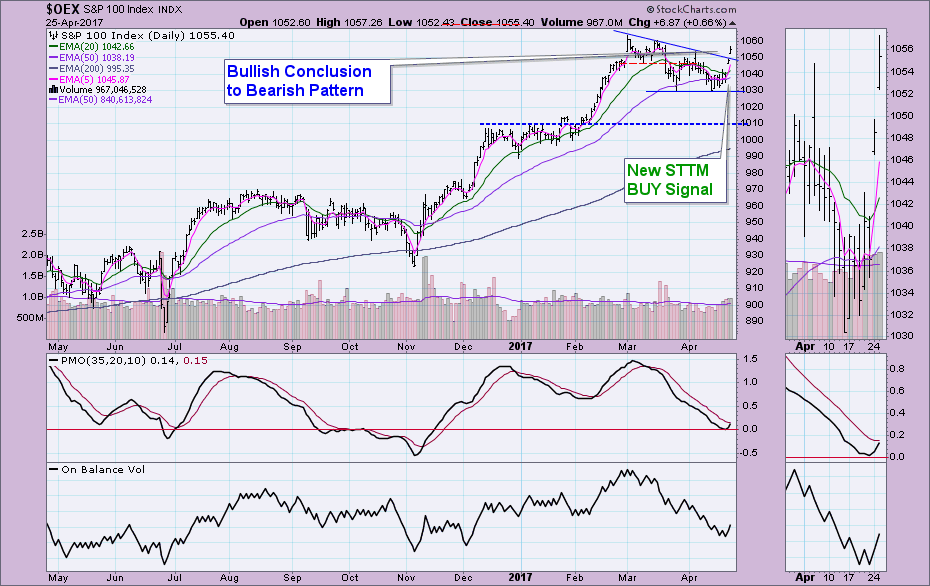
We already saw some shake up on the DP Scoreboards on Friday with the new intermediate-term PMO SELL signals on all but the NDX. With the recent rally, we are now seeing the Scoreboards flip back to bullish in the short term. The S&P 100 is a hair away from producing its PMO BUY signal. I've included the charts below the Scoreboards. You'll note the breakouts on all of the charts. Price is about ready to test all-time highs on all of these indexes.
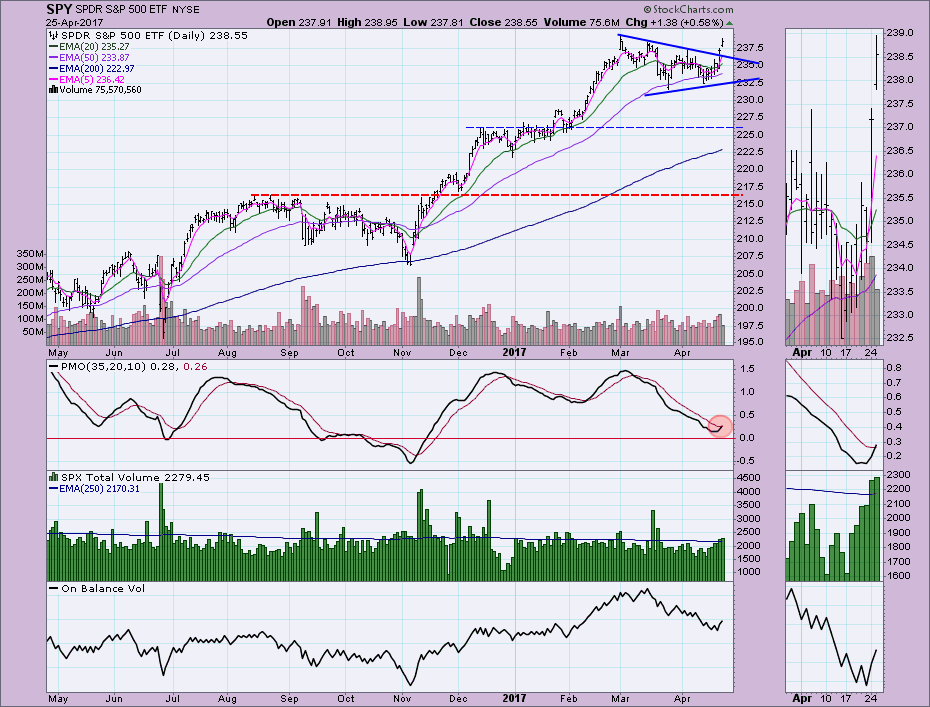
STOCKS: Based upon a 11/15/2016 Intermediate-Term Trend Model BUY signal, our current intermediate-term market posture for the S&P 500 (SPY) is bullish. The Long-Term Trend Model, which informs our long-term outlook, is on a BUY signal as of 4/1/2016 so our long-term posture is bullish.
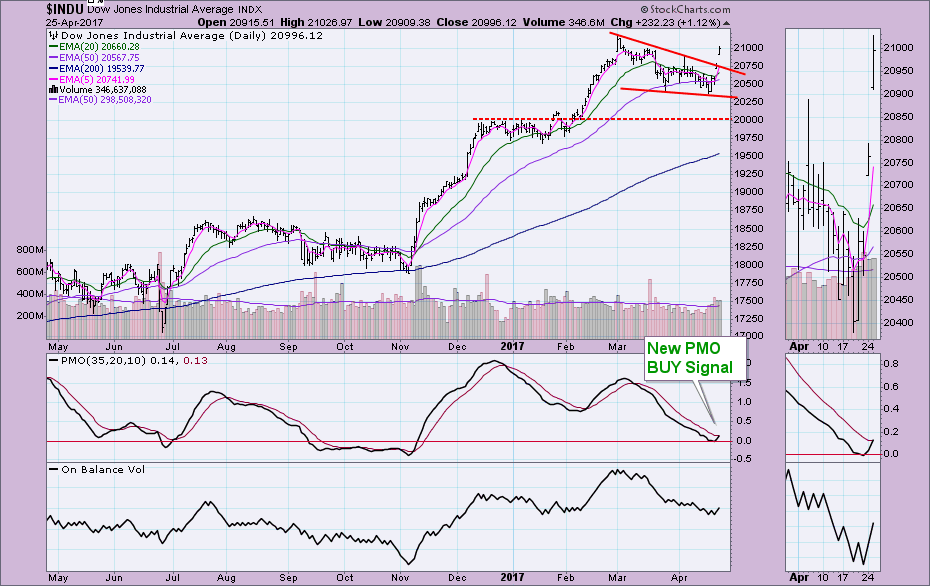
Another gap up today followed by consolidation. The follow-through on yesterday's rally was impressive.
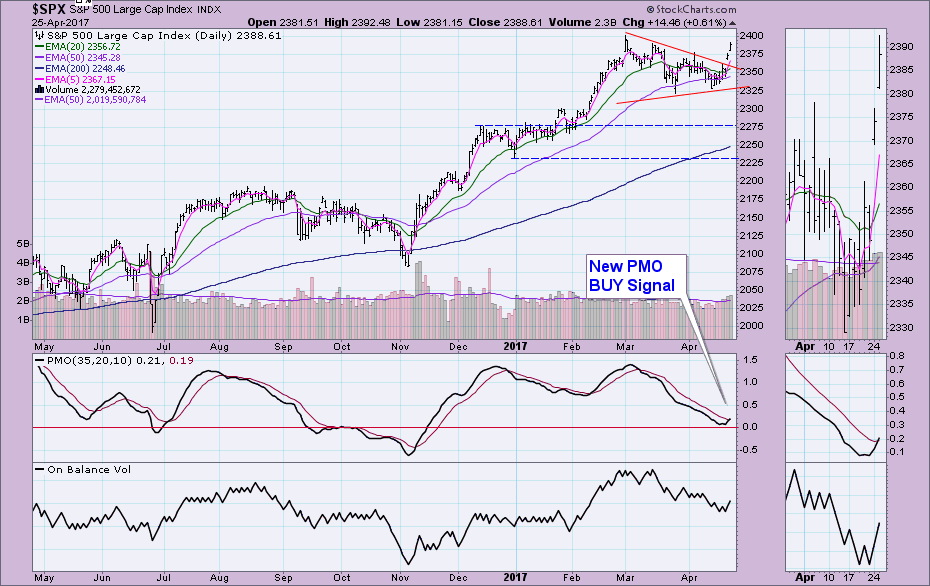
While price broke out above the symmetrical triangle continuation pattern yesterday, today price traded above that new support and is beginning to reach new all-time highs. Note the new PMO BUY signal on strong volume. My main concern right now is a possible buying exhaustion versus an initiation to higher prices.
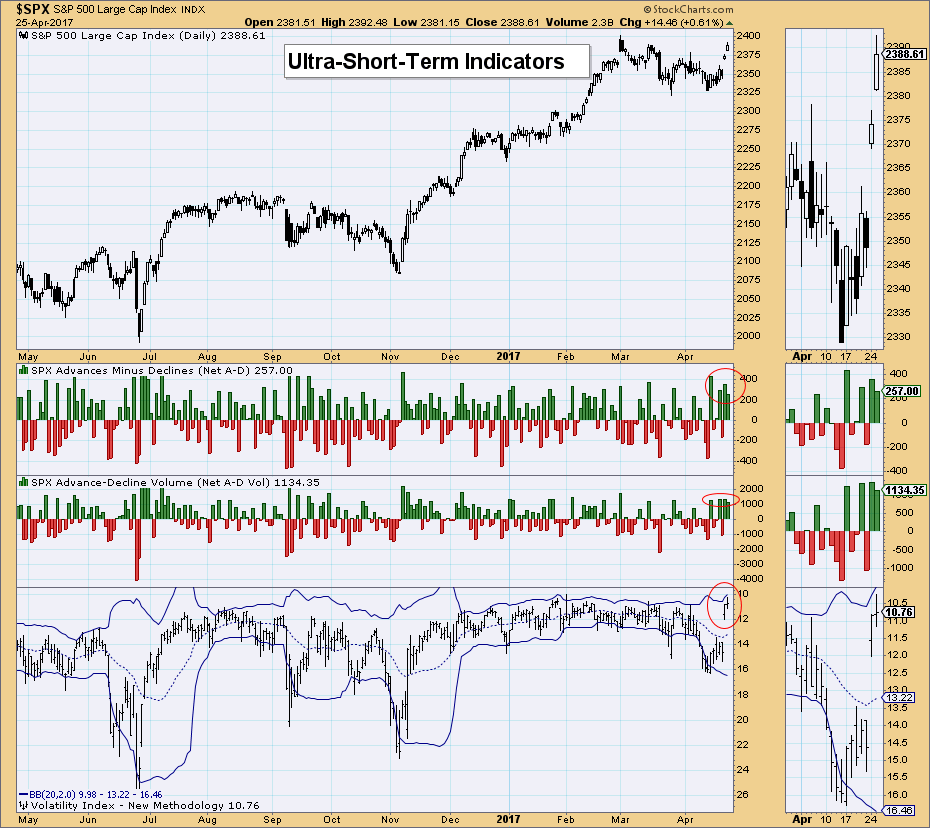
Ultra-Short-Term Indicators: The cluster of positive breadth readings along with a VIX that is about to penetrate the upper Bollinger Band, I'm leaning toward a buying exhaustion. The VIX is considered a measure of market "fear". Seeing investors move into such complacency with these low readings, generally suggests a pending decline.
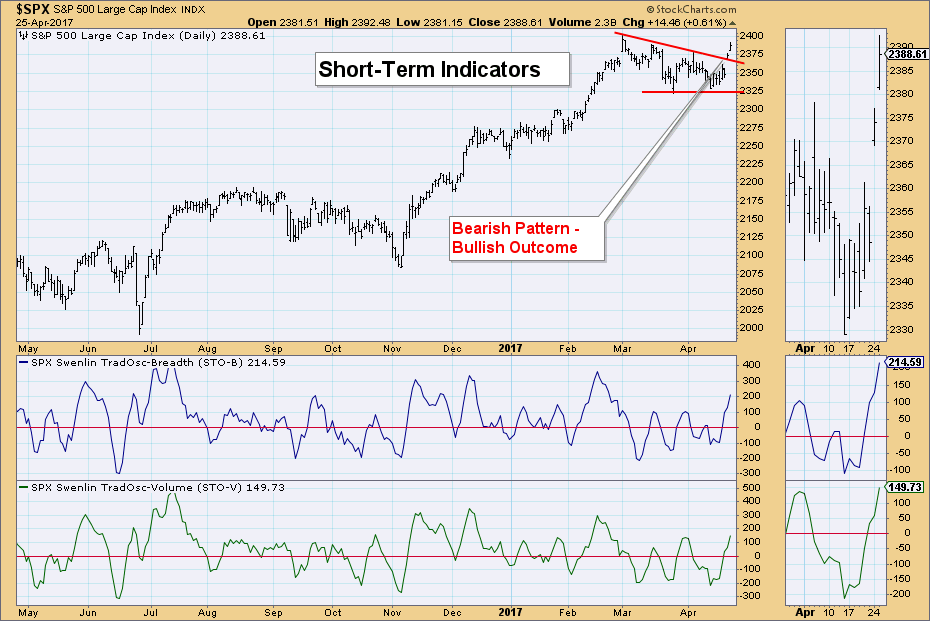
Short-Term Indicators: These indicators are looking very good as they rise strongly. They are getting overbought right now which could be a problem, but there is room to move higher.
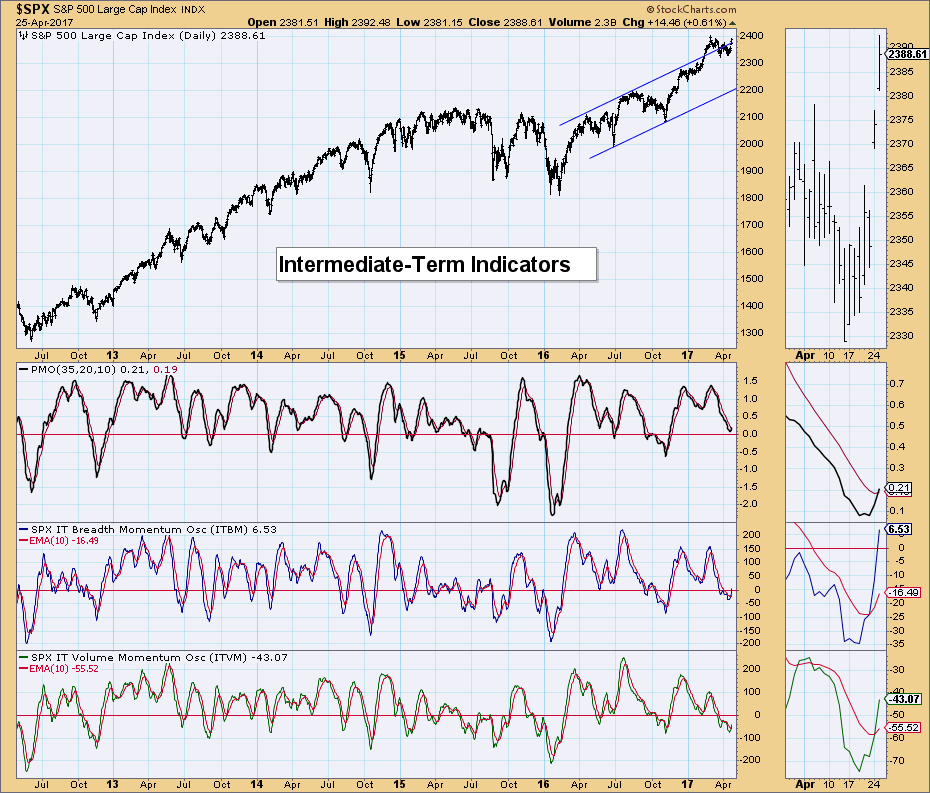
Intermediate-Term Indicators: I like that we got positive crossovers on both the ITBM and ITVM. This is considered very bullish IF they can make this a solid bottom. Right now the bottoms came in right about the time the market began the rally last week. At this point I'm waiting to see if this will turn out to be a false bottom the likes of which we saw at the end of March.
Conclusion: Indicators are mixed right now. While they are leaning bullish, I'm concerned about the VIX, overbought short-term indicators and a possible false bottom on IT indicators. I remain cautiously bullish in the short term.
Click on "In reply to", for Authors past commentaries
Information posted to this board is not meant to suggest any specific action, but to point out the technical signs that can help our readers make their own specific decisions. Your Due Dilegence is a must! • DiscoverGold
Register for free to join our community of investors and share your ideas. You will also get access to streaming quotes, interactive charts, trades, portfolio, live options flow and more tools.


 News
News  Market Data
  Discover