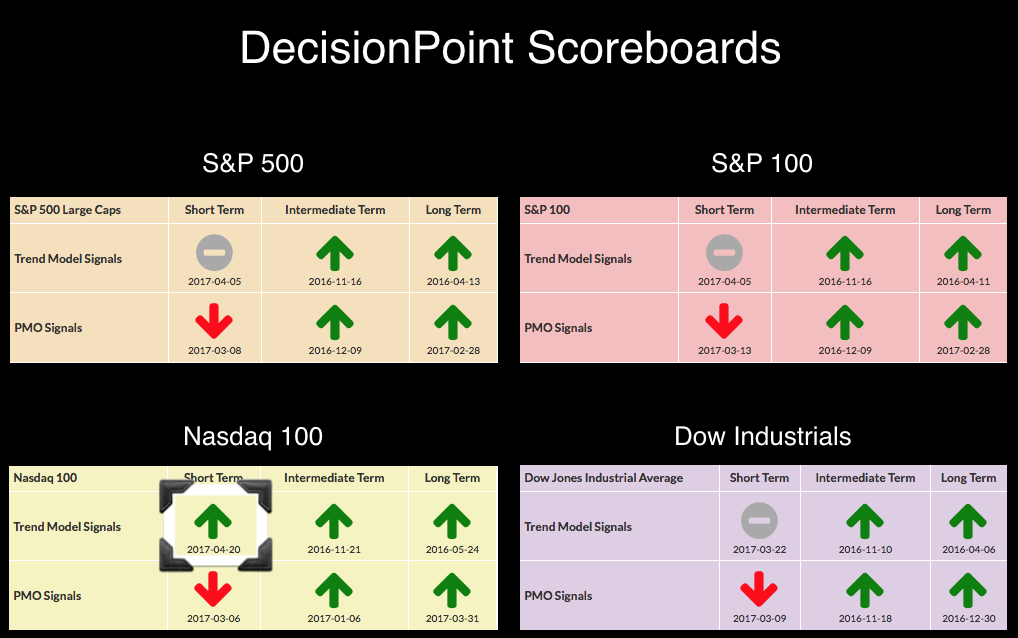
• • •New ST Trend Model BUY for NDX By Erin Heim | April 20, 2017
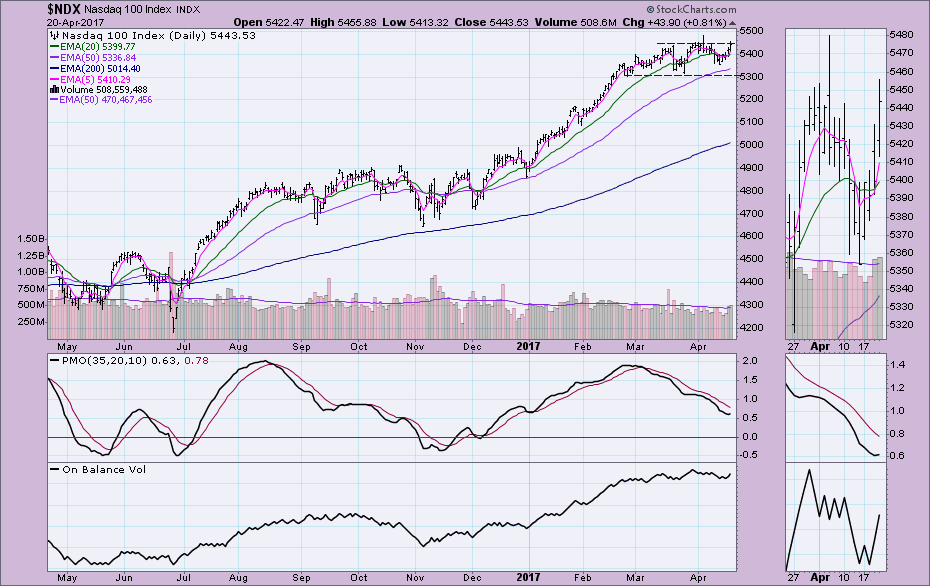
Today the Nasdaq 100 triggered a new Short-Term Trend Model (STTM) BUY signal. This replaces a Neutral signal from exactly one week ago. In the thumbnail of the chart below the DecisionPoint Scoreboards, you can that the Neutral signal was the victim of whipsaw. I've been bearish on the market of late, but looking at NDX price movement, I like the last bottom forming above the previous and a breakout attempt being made to new all-time highs. Note also that the Price Momentum Oscillator (PMO) has now turned up.
The purpose of the DecisionPoint Alert Daily Update is to quickly review the day's action, internal condition, and Trend Model status of the broad market (S&P 500), the nine SPDR Sectors, the U.S. Dollar, Gold, Crude Oil, and Bonds. To ensure that using this daily reference will be quick and painless, we are as brief as possible, and sometimes we let a chart speak for itself.
STOCKS: Based upon a 11/15/2016 Intermediate-Term Trend Model BUY signal, our current intermediate-term market posture for the S&P 500 (SPY) is bullish. The Long-Term Trend Model, which informs our long-term outlook, is on a BUY signal as of 4/1/2016 so our long-term posture is bullish.
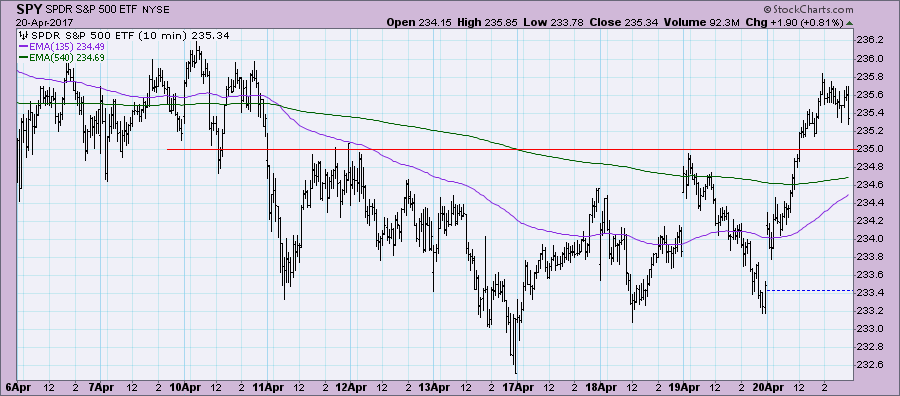
Today price broke above recent resistance and consolidating by the end of the day. Looks like a possible bull flag.
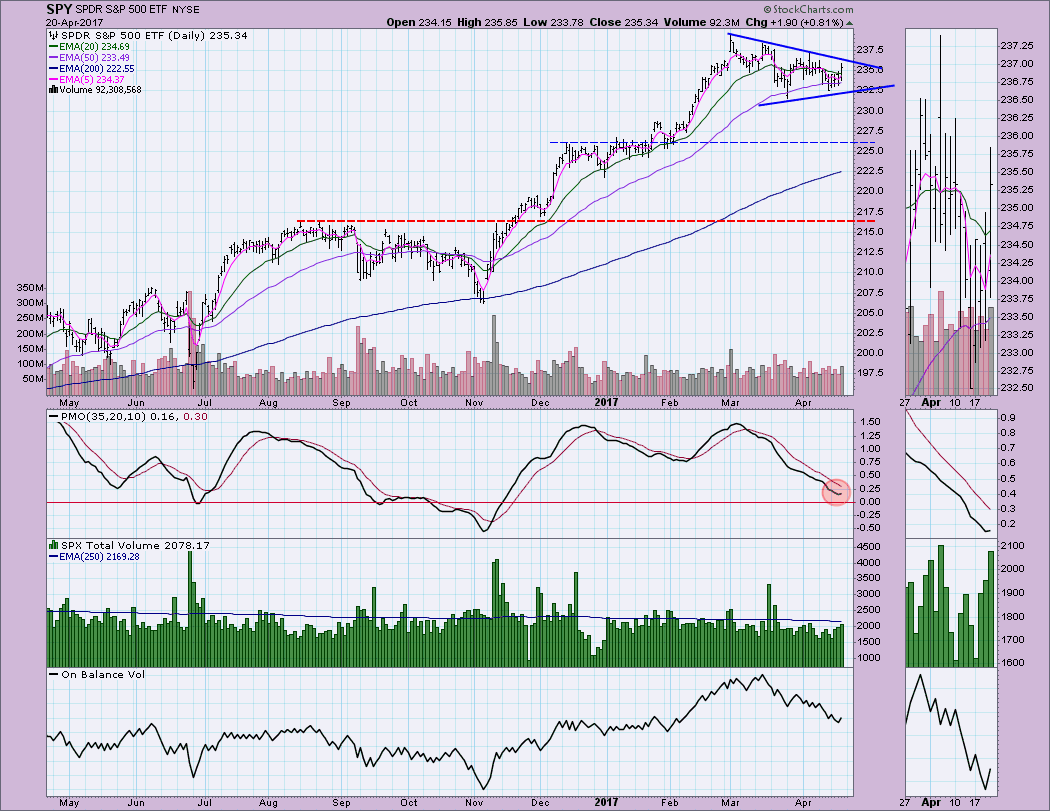
Price is traveling within a symmetrical triangle on the SPY. These patterns are typically continuation patterns which would suggest price should breakout this time around. The PMO is turning up which also increases optimism. It was a sustained rally on increasing volume which is positive. The OBV is not showing us a bullish divergence or confirmation at this time.
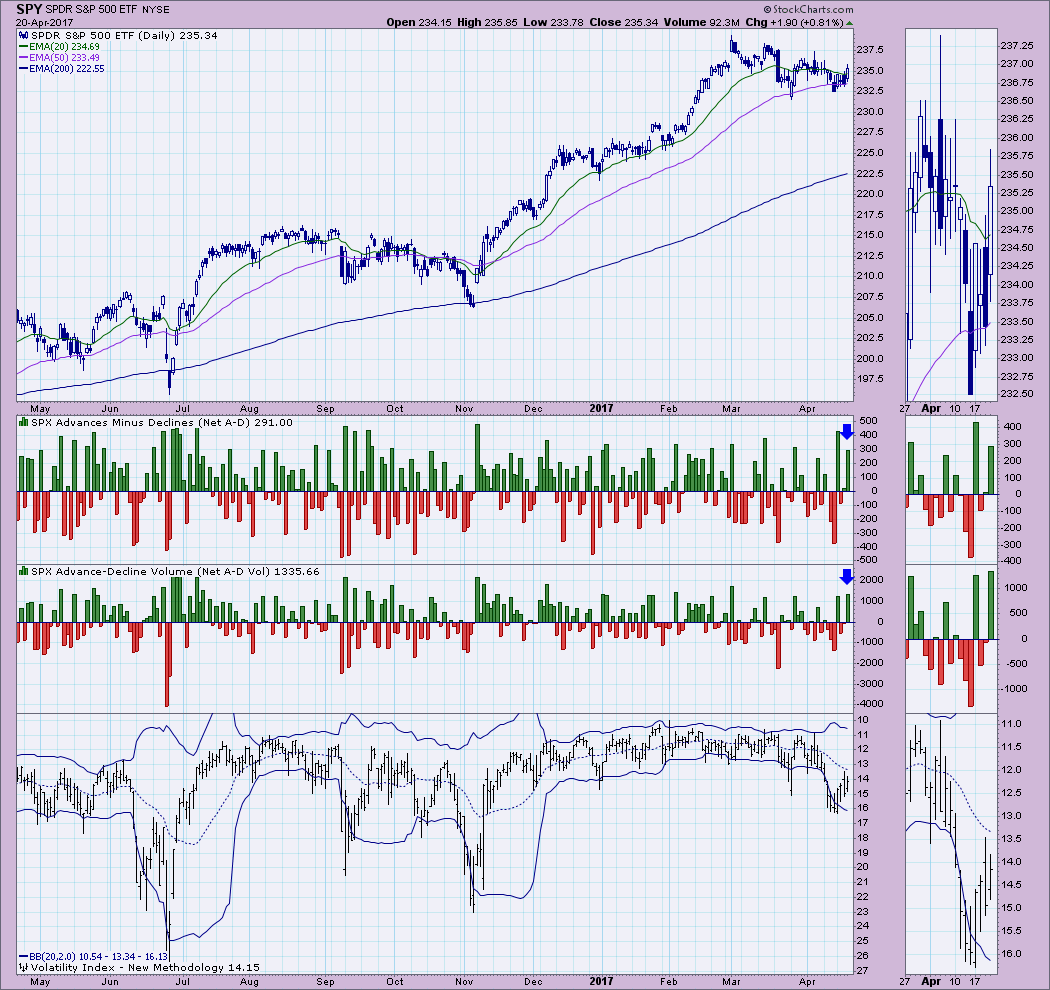
Ultra-Short-Term Indicators: Today saw somewhat climactic breadth readings. However, the VIX didn't really confirm this as a buying initiation. The VIX readings are declining which does suggest more bullishness in the market place, but I like to see band penetrations as confirmation.
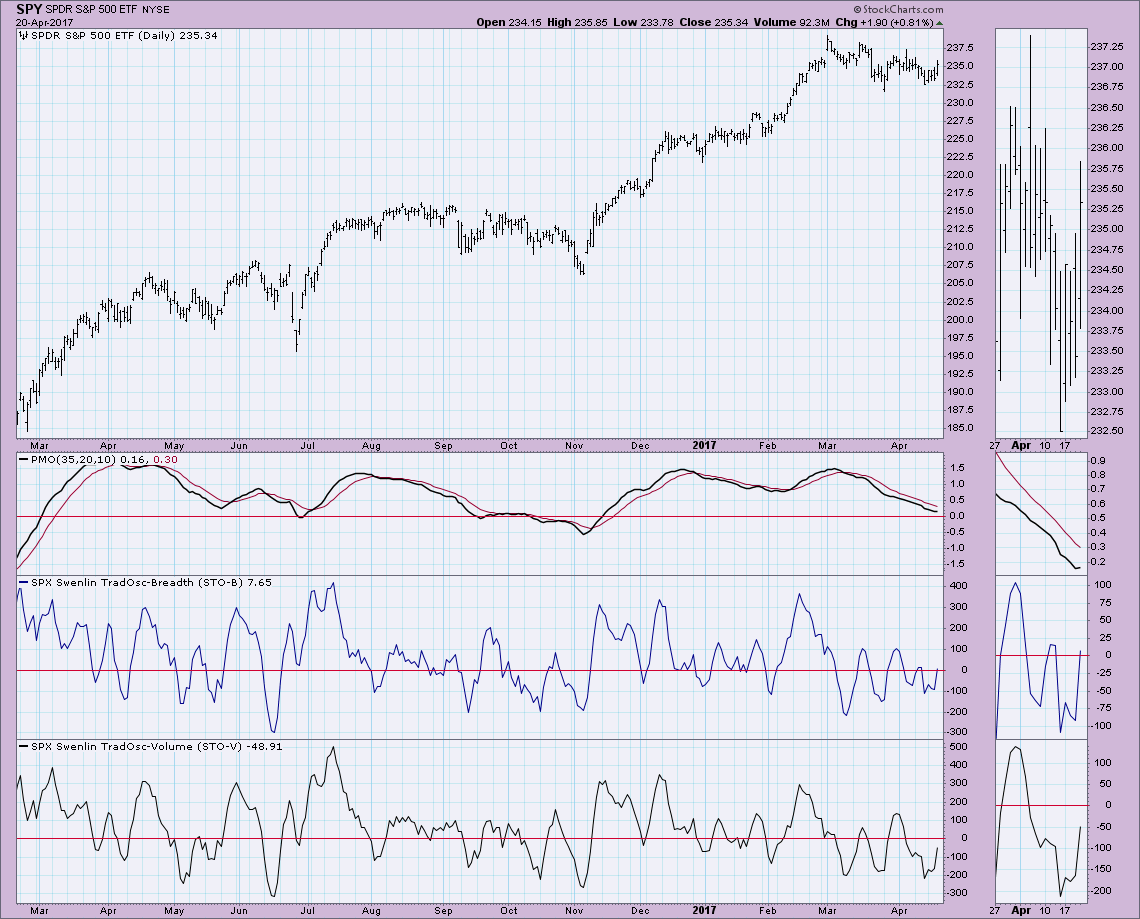
Short-Term Indicators: It appears these indicators have picked a direction and that is 'higher'. Readings are in neutral, but they are rising which is bullish for the short term.
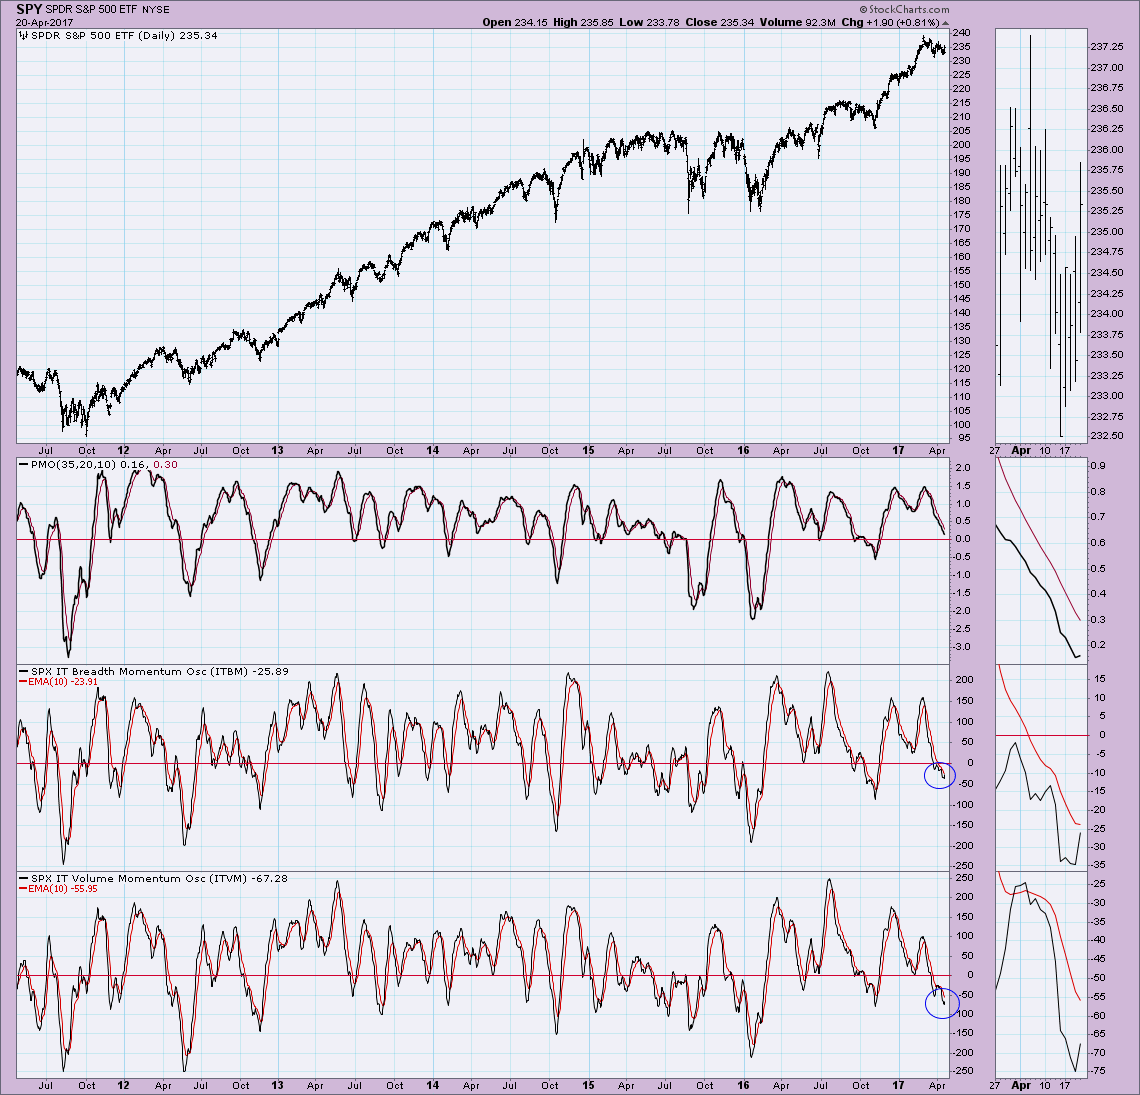
Intermediate-Term Indicators: It's hard to interpret whether this is going to be a reliable bottom on these indicators so it's best to simply wait for the positive crossovers before getting bullish. The readings are sitting in neutral and appear to be rising, I'd call that somewhat bullish.
Conclusion: Price is spiraling into the apex of a symmetrical triangle. It is now testing the top of the triangle. With indicators beginning to look up including a PMO bottom and new BUY signal on the NDX, I'll have to readjust my short-term position to cautiously bullish. . .
Click on "In reply to", for Authors past commentaries
Information posted to this board is not meant to suggest any specific action, but to point out the technical signs that can help our readers make their own specific decisions. Your Due Dilegence is a must! • DiscoverGold
Register for free to join our community of investors and share your ideas. You will also get access to streaming quotes, interactive charts, trades, portfolio, live options flow and more tools.


 News
News  Market Data
  Discover