


Monday, March 20, 2017 6:35:57 PM
In aggregate, I'm still thinking more up-leg within consolidation is available even though some of my experimental stuff gives me cause for concern. I'll stick with $0.83 as near-term likely and, dast I say it!, maybe even some overshoot. But as mentioned, there are some metrics in my unconventional stuff that cause a little trepidation.
In aggregate, today was mostly a flattish day until 13:00 and then took a big step up to go flattish, but with a bigger spread, until just before the close when typical late-day weakness appeared. It was not as weak as has been common though and we closed just a bit below the day's mid-point.
Note that the period ending 13:44 accounted for ~66% of day's volume, mostly because of 13:04's 71.1K that hit $0.76 (3.6K)/$0.7599/$0.76/$0.7699 (64.5K blk)/$0.7599.
There were no pre-market trades.
B/a just before open was 1K:2.2K $0.73/6.
09:30-10:50 opened the day with a 250 buy for $0.76 & $0.75 x 189, $0.76 x 150. B/a just after open was 2K:7.1K $0.7501/$0.76. Then came 9:33's b/a 2.3K:7.1K $0.7501/$0.76 (bids jiggling 9.9K $0.75), 9:34's b/a 1.5K:200 $0.7503/99, 9:34's 3.1K $0.7598 (2K)/02/03, 9:38's 100 $0.7503, 9:42's b/a 1.2K:300 $0.7550/99 (bids jiggling 50/51), 9:47's b/a 1.3K:300 $0.7551/99, 9:49's 100 $0.7599, 9:50's 300 $0.7599, 9:51's 1.9K $0.7551/75 (100)/51, 9:52's 3.6K $0.7551 (3.5K)/90, 9:53's 500 $0.7599, 9:54's b/a 100:5.3K $0.7551/$0.76, 9:53's 5.2K $0.7599/92(2K)/$0.76 (2K)/$0.7551, 9:55's 300 $0.7599/51.
That began extremely low/no-volume $0.7550/$0.76, with slowly rising lows. B/a at 9:58 was 500:5.3K $0.7551/$0.76, 10:05 800:4.8K $0.7551/$0.76 (bids jiggling 50/51). Volume was interrupted by 10:09's 5.4K $0.7551. B/a at 10:14 was 400:4.8K $0.7551/$0.76 (bids jiggling 1.2K 50/800 51). Bids began rising. B/a at 10:22 was 700:4.7K $0.7570/$0.76, 10:32's b/a 600:4.6K $0.7572/$0.76 (jiggling 71/2), 10:47 800:4.2K $0.7573/$0.76. The period ended on 10:50's 258 $0.7568.
10:51-12:22 during the first six no-trades minutes saw b/a get reset and b/a at 10:53 was 500:100 $0.7503/99. Trade began extremely low (and mostly no) $ on 10:57's 600 $0.7503/7. B/a at 11:03 was 1K:300 $0.7504/99, 11:17 900:300 $0.7504/99, 11:50 400:300 $0.7507/99, 12:17 1.5K:200 $0.7508/99. Price and volume were interrupted by 12:18's 2K $0.7583 (most had been low $0.750x). The period ended on 12:22's 200 $0.7509.
12:23-13:44 during the 10 no-trades minutes had 12:32's b/a 200:200 $0.7509/99. Trade began an extremely low/no-volume rise from $0.7599/$0.76 on 12:33's 200 $0.7599. B/a at 12:44 was 1.1K:6.5K $0.7599/$0.76, 12:51 1.3K:6.1K $0.7599/$0.76, 13:04 1.1K:5.7K $0.7599/$0.76.
A noticeable rise began on 13:04's 71.1K that hit $0.76 (3.6K)/$0.7599/$0.76/$0.7699 (64.5K blk)/$0.7599. B/a at 13:12 was 900:500 $0.7651/99 (bids jiggling 51/52), 13:17 700:500 $0.7656/99 (bids jiggling 55/56), 13:18 700:5K $0.7655/$0.77. 13:17's 11.K hit $0.7656/78/99/ ... $0.77/$0.7678/56/$0.77/$0.7656. B/a at 13:20 was 1K:4.9K $0.7655/$0.77, 13:32 800:4.5K $0.7667/$0.77. 13:35, :37's 6.8K & 12K did, respectively, $0.77/$0.7667/84/$0.77/ ... $0.7768/00 and $0.7770 (10K blk)/$0.7687/$0.77. B/a at 13:44 was 100:1.1K $0.7658/$0.77. The period ended on 13:44's 200 $0.77.
13:45-14:45 began extremely low/no-volume $0.7650/$0.77 on 13:54's 100 $0.765. B/a at 14:00 was 700:1.3K $0.7599/$0.77, 14:17 900:1.1K $0.7599/$0.771s. Price was interrupted by 14:23's 3K did $0.7700/67/$0.7599/$0.7685/$0.7770 and 14:28's 2K $0.7707/39/70/39. B/a at 14:28 was 1.9K:6.3K $0.7707/70, 14:33 1.5K:6.3K $0.7716/70 (bids rising). The period ended on 14:45's 4.2K $0.7747/57/44/42/41/00/01/00.
14:46-16:00, after one no-trades minute, began extremely low/no-volume $0.7600/$0.7770 on 14:47's 8.3K $0.7702/1/0/1/0/$0.7697/$0.7599/$0.7701. B/a at 14:50 was 200:300 $0.76/$0.7740, 15:02 200:200 $0.76/$0.7740, 15:15 300:5.8K $0.76/$0.777, 15:34 400:5.1K $0.76/$0.7770, 15:45 200:1.5K $0.76/$0.7710. The period and day ended on 16:00's 1,189 $0.7599.
There were no AH trades.
Excluding the opening and closing trades (didn't qualify), there were 4 larger trades (>=5K) totaling 84,882, 50.27% of day's volume, with a $0.7702 VWAP. For the volume, the count was quite low while the percentage of day's volume was quite high, due to a single "larger larger trade" of ~64K. This suggests to me that there was a bullish sentiment in at least one larger player. Adding in that the VWAP was above the day's $0.7675 reinforces that take by me.
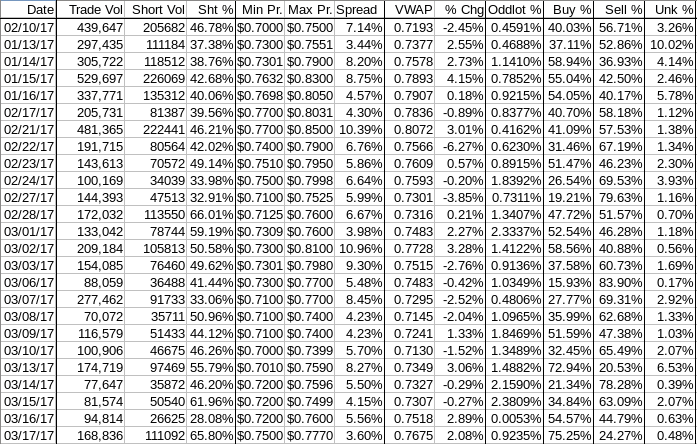
Notice we didn't get a big dump in the buy percentage or VWAP after that large block period. I think this bodes well going forward.Ending Period Period Period __Per. Trade_ Period_ % Day_ Per. End
Period Volume Low High _Dollar Val._ VWAP___ Volume Buy ~%
10:50 26929 $0.7500 $0.7600 $20,373.48 $0.7566 15.95% 34.94% Incl 10:09 $0.7551 5,347
12:22 2900 $0.7503 $0.7583 $2,192.03 $0.7559 1.72% 38.98%
13:44 111723 $0.7599 $0.7770 $86,008.29 $0.7698 66.17% 83.61% Incl 13:04 $0.7699 64,535 13:37 $0.7770 10,000
13:43 $0.7769 5,000
14:45 12150 $0.7599 $0.7770 $9,375.14 $0.7716 7.20% 79.50%
16:00 13589 $0.7599 $0.7770 $10,443.61 $0.7685 8.05% 74.72%
On the traditional TA front, movements were:
Overall, the good behavior continues, suggesting we have some more up-leg available.__Open_ ___Low_ __High_ _Close_ Volume_
Today 5.56% 4.17% 2.24% -0.01% 78.07%
Prior -0.03% 0.00% 1.35% 5.56% 16.23%
On my minimal chart we have confirmation of a breakout above the descending resistance (descending red line).
The fast and slow EMS continued the rise began yesterday and the fast EMA is almost a full penny above the slow EMA.
The day's range was completely above the mid-point of the experimental 13-period Bollinger band, which has a rising mid-point now.
I think it important to note that the former resistance is now support, per conventional TA, and we still have additional support below with the rising medium-term support (orange line), currently around ~$0.704. As mentioned in the past, the longer we stay above it the more likely it acts as strong support if it does get tested. Too bad it's a slow rise though, only ~$0.013/month. But it is confirmed with an origin and two touches.
On my one-year chart the 200-day SMA continued falling. The 50-day SMA had made its cross to rising, two days back declined 2/100ths of a penny and yesterday rose 6/100ths. Today it declined 2/100ths. All it's going to take to smooth this to a steadier rise is a couple days up with smaller downs. xxx <--- Fingers crossed!
The 10-day and 20-day SMAs continued declining but as the 20-day declined faster, the 10-day moved from 1.95 to 1.84 to 1.72 cents below the 20-day.
If we hold here we'll get 1 day (was 2 flat) of declining 10-day SMA and then 6 days of a slow rise. The 20-day would have 4 (was 5) days of decline followed by 3 days of rise. The 50 will go flat 1 day and then rise 15 days. I don't expect this as price rises and falls in waves. The 200-day would fall ~120 (was ~153) days.
Yesterday the oscillators I watch had improvement in RSI, accumulation/distribution, momentum, Williams %R, full stochastic, and ADX-related. A decline occurred in MFI (untrusted by me). RSI and Williams %R are above neutral, momentum is at neutral, and the rest are below neutral.
Today had very marginal deterioration in RSI and accumulation/distribution. There was substantial improvement in MFI (untrusted by me) and momentum, marginal improvement in Williams %R, and big improvement in full stochastic and ADX-related. Everything except accumulation/distribution and ADX-related are above neutral. Nothing is overbought.
The experimental 13-period Bollinger limits, $0.6917 and $0.7821 ($0.6907 and $0.7777 yesterday), continued diverging, as the upper limit rose faster than the lower limit rose, with a rising mid-point.
All in, I think I finally got a strong up-leg confirmation here. Been longer coming than I anticipated - naturally. I tend to be early even when I try to account for the fact that I tend to be early. >

Percentages for daily short sales and buys moved in the same direction, good, but both are well above ranges I consider normal (short needs re-check) and I think the buy percentage overshot again, which would explain the short percentage. It may be the buy percentage, combined with the third consecutive day of rises on rising volume, is enough to spook the shorts into increasing their covering buys. I can't say this is likely or not, but the more frequent order PRs, reduced overhead and improving fundamentals may be reason for them to be concerned.
Today's short percentage is most likely just MM normal naked shorting as they handle sell orders not yet under their control and lots of long-suffering longs decide to lock in profits or reduce losses by selling. It could also just be MMs trying to stay market neutral by increasing shorting at higher prices if they are out of position relative to what the market is doing. This keeps their average cost close to market so that when the inevitable re-trace appears they can cover and at least break even.
The spread narrowed today and is just above where I would think near-term consolidation is indicated. However, it was produced by a predominately flat and then up intra-day behavior, suggesting there's still some upside available near-term. Even the typical weakness into the close was relatively muted.
The VWAP's last twenty-four readings, after holding steady at 12 negatives and 12 positives for four consecutive days, again improved, going to 11 and 13 respectively. Change since 02/10 is $0.0481, 6.69%, and the averages of the rolling 24-day period seen in the last few days (latest first) are now 0.3026%, 0.1137%, 0.1860%, 0.1388%, 0.0588%, -0.1941%, -0.2735%, -0.5653%, -0.5663%, and -0.1786%. Note the changes in the average change over the 24 days now has five consecutive positives. This is a nice positive trend.
All in, the level of the short percentage is a concern, as is the level of the buy percentage. But on a day with the second consecutive day of rising volume during another day of rising range confirming a break above resistance I think this is not as big a negative as I would normally consider it. I'm more concerned that the excessive buy percentage might again result in another overshoot as it moves towards more normal levels.
Applying gut-hunch, and maybe a bit too much hopium, I'm going to stick with my beloved up-leg within consolidation and say I think more near-term upside is available until we get at/near my $0.83 target at least.
Bill
Join the InvestorsHub Community
Register for free to join our community of investors and share your ideas. You will also get access to streaming quotes, interactive charts, trades, portfolio, live options flow and more tools.

