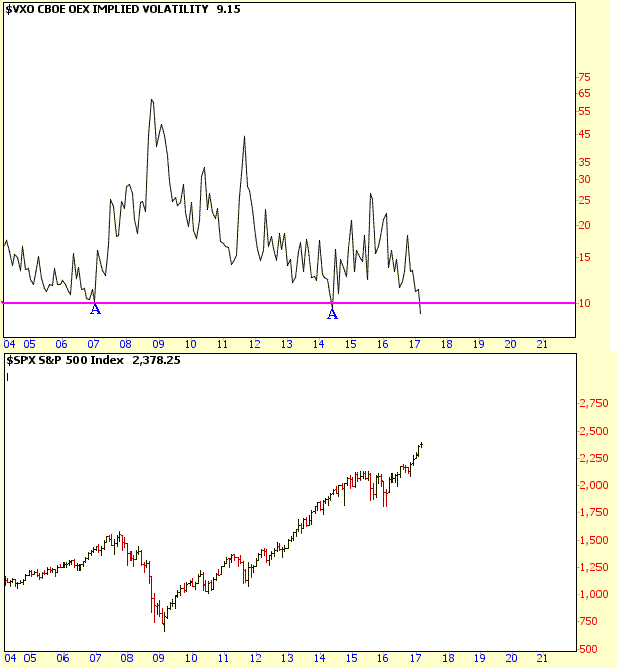
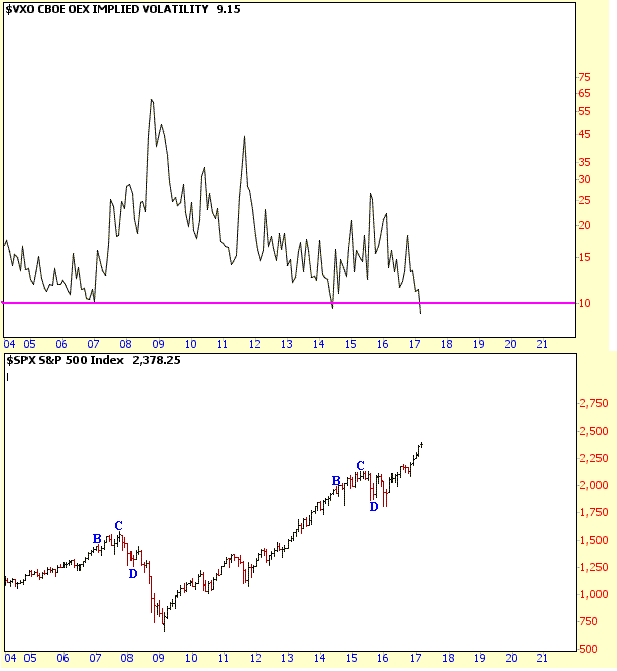
The Implied Volatility of the S&P (VXO), on a monthly basis, has dropped back to the 10 level for only the third time in the last 15 years. The last two times this occurred was in June of 2014 and January of 2007 (points A).
Both of these prior events weren't followed by an immediate top, as the S&P 500 was able to rise further (points B to C) before a more significant correction occurred (points C to D).
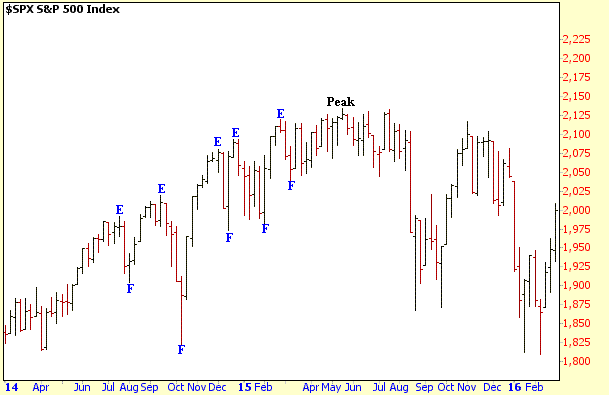
Finally, as witnessed with the prior two events, it doesn't mean the S&P 500 will go straight up from it's current level. Notice in 2014, that the S&P 500 went through a series of choppy corrections (points E to F) while moving higher before peaking in May of 2015.
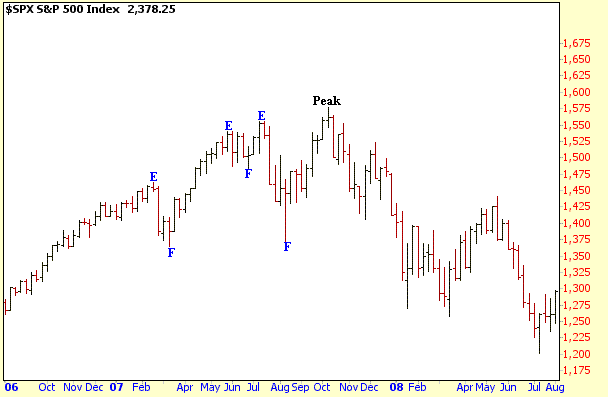
Meanwhile in 2007, similar type corrections occurred (points E to F), as the S&P 500 moved higher before peaking in the Fall of that year.
Click on "In reply to", for Authors past commentaries
Information posted to this board is not meant to suggest any specific action, but to point out the technical signs that can help our readers make their own specific decisions. Your Due Dilegence is a must! • DiscoverGold
Register for free to join our community of investors and share your ideas. You will also get access to streaming quotes, interactive charts, trades, portfolio, live options flow and more tools.


 News
News  Market Data
  Discover