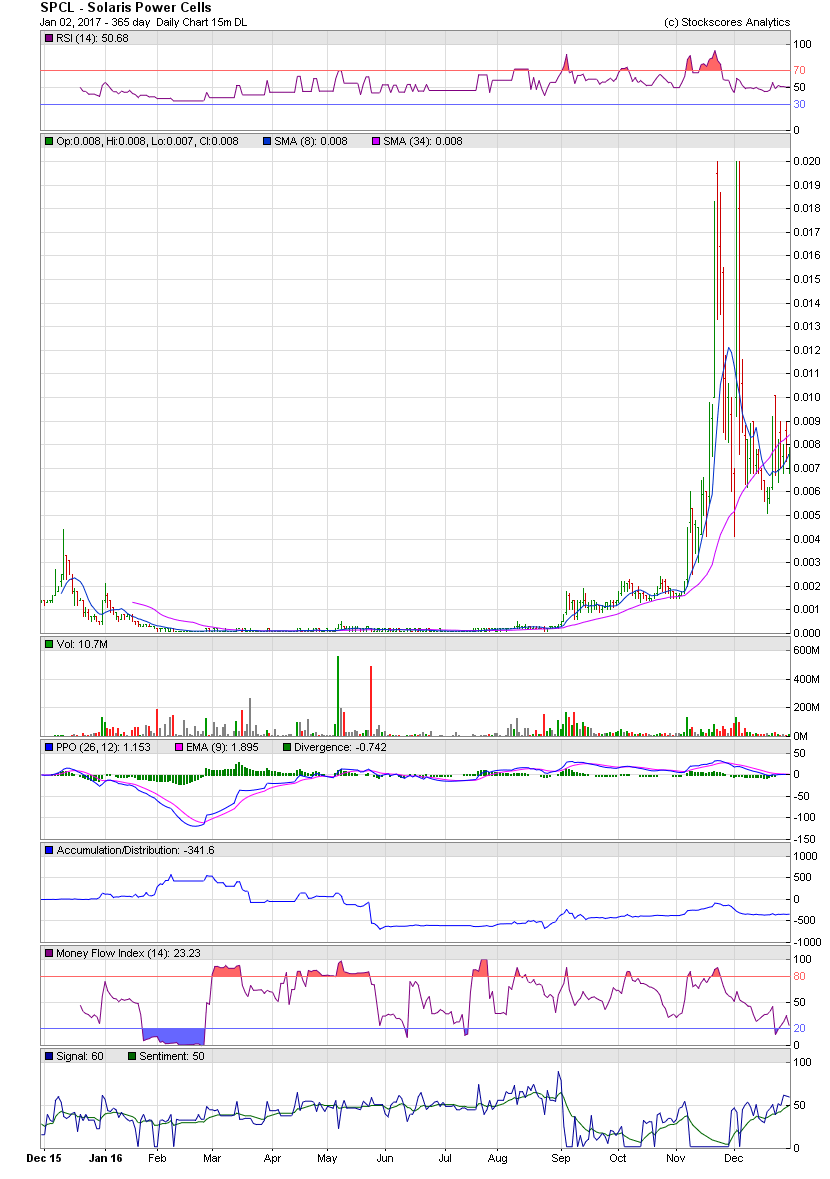
RDAR - Climbing like SPCL March 8, 2017 RDAR - Live! Chart Analysis Video https://www.youtube.com/watch?v=IL2RaIcNh-Q RDAR - Alerted at 0.0001 like SPCL http://investorshub.advfn.com/boards/read_msg.aspx?message_id=129378949 RDAR - Golden Opportunity to Load like SPCL http://investorshub.advfn.com/boards/read_msg.aspx?message_id=129376778 RDAR Chart has Strong Technical Formation like SPCL http://investorshub.advfn.com/boards/read_msg.aspx?message_id=129378284 RDAR - Penny RUNNER like SPCL http://investorshub.advfn.com/boards/read_msg.aspx?message_id=129242851 http://investorshub.advfn.com/boards/read_msg.aspx?message_id=129092753 RDAR - Gonna Go Up FAST like SPCL http://investorshub.advfn.com/boards/read_msg.aspx?message_id=129376626 RDAR - Climbing like SPCL http://investorshub.advfn.com/boards/read_msg.aspx?message_id=129373662 RDAR - BREAKING OUT like SPCL http://investorshub.advfn.com/boards/read_msg.aspx?message_id=129016992 http://investorshub.advfn.com/boards/read_msg.aspx?message_id=128961579 RDAR - SPCL http://investorshub.advfn.com/boards/read_msg.aspx?message_id=128880597 RDAR - SPCL - The Pop, Drop and Run http://investorshub.advfn.com/boards/read_msg.aspx?message_id=128226066 http://investorshub.advfn.com/boards/read_msg.aspx?message_id=128040519 ________________________________________________________________ Embedded Chart https://investorshub.advfn.com/uimage/uploads/2017/1/2/duvccSPCL_Jan_2_Chart_1.png https://www.stockscores.com/chart.asp?TickerSymbol=RDAR&TimeRange=365&Interval=d&Volume=1&ChartType=OHLC&Stockscores=1&ChartWidth=830&ChartHeight=500&LogScale=None&Band=None&avgType1=SMA&movAvg1=8&avgType2=SMA&movAvg2=34&Indicator1=RSI&Indicator2=PPO&Indicator3=AccDist&Indicator4=MFI&endDate=&CompareWith=&entryPrice=&stopLossPrice= http://www.stockscores.com/chart.asp?TickerSymbol=SPCL&TimeRange=180&Interval=d&Volume=1&ChartType=OHLC&Stockscores=1&ChartWidth=830&ChartHeight=500&LogScale=None&Band=None&avgType1=SMA&movAvg1=8&avgType2=SMA&movAvg2=34&Indicator1=RSI&Indicator2=PPO&Indicator3=AccDist&Indicator4=MFI&endDate=&CompareWith=&entryPrice=&stopLossPrice= https://www.stockscores.com/chart.asp?TickerSymbol=RDAR&TimeRange=365&Interval=d&Volume=1&ChartType=OHLC&Stockscores=1&ChartWidth=830&ChartHeight=500&LogScale=None&Band=None&avgType1=SMA&movAvg1=8&avgType2=SMA&movAvg2=34&Indicator1=RSI&Indicator2=PPO&Indicator3=AccDist&Indicator4=MFI&endDate=&CompareWith=&entryPrice=&stopLossPrice= https://www.stockscores.com/chart.asp?TickerSymbol=SPCL&TimeRange=365&Interval=w&Volume=1&ChartType=OHLC&Stockscores=1&ChartWidth=830&ChartHeight=500&LogScale=None&Band=None&avgType1=SMA&movAvg1=8&avgType2=SMA&movAvg2=34&Indicator1=RSI&Indicator2=PPO&Indicator3=AccDist&Indicator4=MFI&endDate=&CompareWith=&entryPrice=&stopLossPrice= https://www.stockscores.com/chart.asp?TickerSymbol=RDAR&TimeRange=365&Interval=w&Volume=1&ChartType=OHLC&Stockscores=1&ChartWidth=830&ChartHeight=500&LogScale=None&Band=None&avgType1=SMA&movAvg1=8&avgType2=SMA&movAvg2=34&Indicator1=RSI&Indicator2=PPO&Indicator3=AccDist&Indicator4=MFI&endDate=&CompareWith=&entryPrice=&stopLossPrice= https://investorshub.advfn.com/uimage/uploads/2017/1/2/duvccSPCL_Jan_2_Chart_1.png https://www.stockscores.com/chart.asp?TickerSymbol=RDAR&TimeRange=365&Interval=d&Volume=1&ChartType=OHLC&Stockscores=1&ChartWidth=830&ChartHeight=500&LogScale=None&Band=None&avgType1=SMA&movAvg1=8&avgType2=SMA&movAvg2=34&Indicator1=RSI&Indicator2=PPO&Indicator3=AccDist&Indicator4=MFI&endDate=&CompareWith=&entryPrice=&stopLossPrice=
 News
News  Market Data
  Discover