


Tuesday, March 07, 2017 3:56:57 PM
First Images from GOES-16 Lightning Mapper
Published on Mar 6, 2017 by NOAASatellites [ http://www.youtube.com/channel/UCJJqaSw7Z7SD7TM80cViEGg / http://www.youtube.com/user/NOAASatellites , http://www.youtube.com/user/NOAASatellites/videos ]
Lightning observed by the GOES-16 Geostationary Lightning Mapper (GLM) illuminates the storms developing over southeast Texas on the morning of February 14, 2017, in this animation of GLM lightning events overlaid on Advanced Baseline Imager (ABI) cloud imagery. Frequent lightning is occurring with the convective cells embedded in this severe weather system. The green cross indicates the location of Houston, and green dotted lines indicate the Texas coastline. This animation, rendered at 25 frames per second, simulates what your eye might see from above the clouds. GLM perceives the scene at 500 frames per second, and can distinguish the location, intensity and horizontal propagation of individual strokes within each lightning flash. Monitoring the flash rate from convective cells and their extent can help forecasters improve tornado and severe weather forecasts and warnings and their impending threat to the public. At the time of this animation, the storm cell in the center of the frame was reported by the NWS to have spawned one of a number of tornadoes and damaging winds spawned by the storm complex.
Credit: NOAA/NASA
Note: This is preliminary, non-operational data as GOES-16 undergoes on-orbit testing.
http://www.youtube.com/watch?v=Jcx7gv-LaKs [with comments]
*
GOES-16 One-Minute Imagery of Severe Storms over Nebraska
Published on Mar 7, 2017 by NOAASatellites
On March 6, 2017, a potent weather system moved into the central plains and generated a plethora of dynamic weather, including high winds, large hail, and tornadoes, in addition to fanning a number of large grass fires. This 500-m resolution visible loop from GOES-16 shows the formation of the storms in eastern Nebraska just after 1 p.m. CST. The one-minute update frequency allows forecasters to track individual cumulus cloud formation and to see the up-down pulsing nature of the storms' overshooting tops. The first large hail report occurred just after 2 p.m. in eastern Nebraska and the first tornado at 5:30 pm near Harcourt, Iowa. Storms continued into the overnight hours in Iowa, Minnesota, Wisconsin, Kansas, Missouri, Illinois, Oklahoma, and Arkansas, and produced at least 36 tornadoes and many high wind and large hail reports.
Credit: NOAA/NASA
Note: This is preliminary, non-operational data as GOES-16 undergoes on-orbit testing.
http://www.youtube.com/watch?v=WuC8wk_B5to [with comments]
*
First Solar Images from GOES-16
Published on Feb 27, 2017 by NOAASatellites
The first images from the Solar Ultraviolet Imager (SUVI) instrument aboard NOAA’s GOES-16 satellite captured a large coronal hole on the sun on January 29, 2017. The sun’s 11-year activity cycle is currently approaching solar minimum and during this time powerful solar flares become scarce and coronal holes become the primary space weather threat. Once operational, SUVI will capture full-disk solar images around-the-clock and will be able to see more of the environment around the sun than earlier NOAA geostationary satellites.
The sun’s upper atmosphere, or solar corona, consists of extremely hot plasma, an ionized gas. This plasma interacts with the sun’s powerful magnetic field, generating bright loops of material that can be heated to millions of degrees. Outside hot coronal loops, there are cool, dark regions called filaments which can erupt and become a key source of space weather when the sun is active. Other dark regions are called coronal holes, which occur where the sun’s magnetic field allows plasma to stream away from the sun at high speed, resulting in cooler areas. The effects linked to coronal holes are generally milder than those of coronal mass ejections, but when the outflow of solar particles in intense, they can still pose risks to Earth.
The solar corona is so hot that it is best observed with X-ray and extreme-ultraviolet (EUV) cameras. Various elements emit light at specific EUV and X-ray wavelengths depending on their temperature, so by observing in several different wavelengths, a picture of the complete temperature structure of the corona can be made. The GOES-16 SUVI observes the sun in six EUV channels.
SUVI will allow the NOAA Space Weather Prediction Center to provide early space weather warnings to electric power companies, telecommunication providers and satellite operators.
Depending on the size and the trajectory of solar eruptions, impacts to Earth can result in geomagnetic storms which disrupt power utilities, communication and navigation systems, and may cause radiation damage to orbiting satellites and the International Space Station.
For more information about SUVI visit http://www.goes-r.gov/ .
Note: This is preliminary, non-operational data as GOES-16 undergoes on-orbit testing.
http://www.youtube.com/watch?v=21807n8WHa0 [with comments]
*
GOES-16 Composite Color of Dust Clouds over Texas
Published on Feb 24, 2017 by NOAASatellites
Dust clouds sweep across north-central Texas in this 1-km GOES-16 composite color animation from 2030 to 2310 UTC on February 23, 2017.
As this animation suggests, the ability of GOES-16's Advanced Baseline Imager (ABI) to provide such high-resolution imagery in color will be a boon to meteorologists as it will make it easier for them to identify different atmospheric or meteorological phenomena, such as dust from other types of clouds. As shown here, the brown-colored dust is easy to differentiate from smaller, white clouds mixed in with it.
Composite color images from GOES-16 are created by combining data from three of ABI's 16-bands -- band 1 (blue visible), band 2 (red visible) and band 3 (near-infrared vegetation) -- to produce a range of colors within visible part of the electromagnetic spectrum (think the colors of the rainbow, ROYGBIV).
Credit: NOAA/NASA
Note: This is preliminary, non-operational data as GOES-16 undergoes on-orbit testing.
http://www.youtube.com/watch?v=pZrHxdOmWeU [with comment]
*
GOES-16 vs. GOES-13 Shortwave Infrared of Grass Fires in Florida
Published on Feb 23, 2017 by NOAASatellites
This comparison of GOES-16 ABI and GOES-13 imager shortwave infrared (3.9 µm) data shows a number of grass fires burning near Lake Okeechobee in southern Florida on February 20, 2017. In the left panel, GOES-16 imagery at 30-second intervals is shown, while the right panel displays GOES-13 imagery at routine 15-30 minute intervals. The warmest shortwave infrared brightness temperatures are enhanced with yellow to red colors (with red being the hottest). Note the many advantages of the 30-second GOES-16 imagery: (1) new fire starts are detected sooner in time; (2) the fire behavior (intensification vs dissipation) can be better monitored; (3) the intensity of the fires is more accurately depicted with the 2-km resolution GOES-16 data vs the 8-km resolution GOES-13 data; (4) numerous brief fires are not detected at all in the 15-30 minute interval GOES-13 imagery (especially south and southeast of Lake Okeechobee, during the 2100-2115 UTC time period).
Credit: NOAA/NASA
Note: This is preliminary, non-operational data as GOES-16 undergoes on-orbit testing.
http://www.youtube.com/watch?v=BT7vN9pRSZ4 [with comment]
*
GOES-16 Rapid Scan Imagery of Severe Storms in Argentina
Published on Feb 22, 2017 by NOAASatellites
This incredible 30-second rapid-scan animation from GOES-16 demonstrates the very high spatial and temporal resolution from the Advanced Baseline Imager (ABI). The rapid scan sector was set over north-central Argentina, which includes the city of Córdoba, where it captured some expected severe storms during an active late-summer weather pattern. This region is known to have some of the most extreme storms in the world.
The animation was created with the ABI band 2, its primary visible channel. Many interesting and important features of the near storm environment and convective clouds themselves are readily apparent. Differential motion between the developing thunderstorms and the low level clouds indicates the presence of converging low-level air leading to the rapid development of these storms. Apparent rotation in the boiling cloud tops suggests intense updrafts or vertical motion in these storms. Severe hail was reported with at least one of the storms in the center of the domain around 2130 UTC.
This movie provides a proof of concept for the RELAMPAGO (Spanish for “lightning”) field campaign. RELAMPAGO is an international project set for 2018-2019, whose goal is to study high impact weather and hydrometeorological extremes in central Argentina. It will also provide additional validation data sets to assess the ABI and Geostationary Lightning Mapper performance. Also of note is this data collection represents our first outside continental US test of the rapid scan capability of ABI on severe local storms.
Credit: NOAA/NASA
Note: This is preliminary, non-operational data as GOES-16 undergoes on-orbit testing.
http://www.youtube.com/watch?v=R8yFZI2idb0 [no comments yet]
*
GOES-16 Band 5 Imagery of Thunderstorms over the Texas Gulf Coast
Published on Feb 17, 2017 by NOAASatellites
This animation of GOES-16 rapid-scan near-infrared imagery shows the movement of thunderstorms over the Texas Gulf Coast on February 14, 2017. Note the clarity of the clouds, both liquid (brighter) and ice (darker), as well as the waves and shadows that can be seen in this loop.
This animation was created with the Advanced Baseline Imager's (ABI) band 5, which is often referred to as the "snow/ice band" because it will be used to assist with daytime cloud, snow, and ice discrimination among other tasks. Band 5 is one of the new spectral bands on GOES-16 that the previous GOES imagers do not have.
Rapid-scan imagery from GOES-16 will help forecasters monitor storms associated with severe weather as the spacecraft can capture one image of a storm every 30 seconds. This additional data, coupled with the increased resolution of the satellite's imager, will give meteorologists a better chance of seeing smaller details that less advanced satellite imagers could not detect.
Credit: NOAA/NASA
Note: This is preliminary, non-operational data as GOES-16 undergoes on-orbit testing.
http://www.youtube.com/watch?v=iO1hGsD4itM [with comment]
*
NOAA's GOES-16 Sees Northeast Winter Storm Strengthen
Published on Feb 14, 2017 by NOAASatellites
Bombogenesis of northeast winter storm on February 13, 2017.
This water vapor imagery from GOES-16 shows the intensification of the winter storm that brought heavy snow to Maine and other areas of the Northeast yesterday, February 13, 2017.
According to NOAA's Weather Prediction Center, as the yesterday's winter storm in the Northeast moved off the coast and over the northwestern Atlantic, its surface pressure dropped from 996 hectopascals (hPA) at 11:00 am yesterday to 972 hPA at 10:30 pm, a drop of 24 hPA in 18.5 hours. (Note: A hectopascal (hPA) is a unit of pressure equal to a millibar.)
This rapid drop in barometric pressure is what meteorologists sometimes refer to as a "bomb," a term the NOAA Glossary defines as "the rapid intensification of a cyclone (aka: low pressure system) wherein the surface pressure falls by at least 24 millibars in a 24 hour period." (The term "bombogenesis" -- a combination of "bomb" and "cyclogenesis" -- which means the development of a cyclonic circulation) -- is sometimes used to describe these types of systems.
Credit: NOAA/NASA
Note: This is preliminary, non-operational data as GOES-16 undergoes on-orbit testing.
http://www.youtube.com/watch?v=x4Td5M1xE8w [with comment]
*
Water Vapor Imagery of Developing Winter Storm
Published on Feb 13, 2017 by NOAASatellites
This water vapor imagery from February 9, 2017, shows the early stages of a developing winter storm along the East Coast as seen by both GOES-16 (left) and GOES-13 (right).
The current GOES imager only has one mid-level water vapor band, while the Advanced Baseline Imager (ABI) on GOES-16 has three. This allows ABI to capture water vapor features and atmospheric motion within more layers of the atmosphere, which helps numerical weather prediction models better depict of the current state of the atmosphere, and leads to better forecasts of storm development and movement.
For example, note the finer spatial resolution of ABI band (approximately 2 km) as compared to the imager aboard GOES-13 (approximately 4 km). The fine detail of small-scale mountain waves can be seen in the ABI data, but not in the current GOES images. Similarly, during the later portion of the animation, a post-cold-frontal trough can be seen offshore moving southward in the imagery from GOES-16, but not in the GOES-13 imagery. The faster processing afforded by ABI is also evident, with 5 minute imagery, versus 15 or 30 minute from the current GOES imager. More frequent imagery is important, as it allows for quicker detection of fast-developing convection and other phenomena.
Credit: NOAA/NASA
Note: This is preliminary, non-operational data as GOES-16 undergoes on-orbit testing.
http://www.youtube.com/watch?v=phLUzQMtSr8 [no comments yet]
*
Louisiana Tornadoes in all 16 Spectral Bands from GOES-16
Published on Feb 10, 2017 by NOAASatellites
What do we mean when we talk about the 16 spectral bands offered by GOES-16's Advanced Baseline Imager? This animation of the severe storm system that produced tornadoes in southeastern Louisiana on February 7, 2017, shows ABI's 2 visible, 4 near-infrared and 10 infrared spectral bands in time sequence. Monitoring the weather in different wavelengths allows meteorologists to better analyze different layers of the atmosphere, distinguish between cloud types and other phenomena and generally see the Earth's atmosphere and surface in greater, more vivid detail. For example, ABI band 5 (also known as the Snow/ice near infrared band), which is new to GOES satellites, will help meteorologists distinguish glaciated or ice clouds from other cloud types.
Credit: NOAA/NASA
Note: This is preliminary, non-operational data as GOES-16 undergoes on-orbit testing.
http://www.youtube.com/watch?v=ELT3axpZiV8 [no comments yet]
*
GOES-16 Water Vapor Imagery of Nor'easter
Published on Feb 10, 2017 by NOAASatellites
A strong coastal winter storm brought heavy snow and strong winds to portions of the northern Middle Atlantic through northern New England on February 9, 2017. The development and path of this intense storm can be seen in this water vapor imagery from GOES-16. Of particular interest in this animation is the improved spatial resolution compared to current GOES. The satellite's Advanced Baseline Imager offers 16 spectral bands, three of which are water vapor bands -- this imagery was created with band 10. These additional water vapor bands enable meteorologists to see further down into the mid-troposphere in clear sky regions compared to the current GOES water vapor band. It also allows them better characterize the total amount of moisture in the atmosphere that can turn into rain and snow.
Credit: NOAA/NASA
Note: This is preliminary, non-operational data as GOES-16 undergoes on-orbit testing.
http://www.youtube.com/watch?v=ahMNuYpMn8c [no coments yet]
*
GOES-16 and GOES-13 Comparison of Punch Cloud Over North Carolina
Published on Feb 9, 2017 by NOAASatellites
“Punch” or “hole streak” clouds are formed when part of a liquid water cloud glaciates, most likely due to interactions with an airplane. These clouds can be seen in this animation showing the sky over northern North Carolina on February 1, 2017. The visible imagery on the top half is from ABI aboard the recently launched GOES-16, while the visible imagery on the bottom is from the imager aboard GOES-13 (aka: GOES East).
Credit: NOAA/NASA
Note: This is preliminary, non-operational data as GOES-16 undergoes on-orbit testing.
http://www.youtube.com/watch?v=Jg8PJHQxS4A [no comments yet]
*
GOES-16 Sees Tornadic Storms in Louisiana on February 7, 2017
Published on Feb 8, 2017 by NOAASatellites
This visible animation from GOES-16 shows the tornadic storms that swept through Louisiana yesterday, February 7, 2017. According to several news outlets, Louisiana remains in a state of emergency after the storms destroyed homes and businesses, disrupted power, and injured dozens of people in the southeastern part of the state.
As this imagery illustrates, the high-resolution offered by GOES-16's Advanced Baseline Imager will allow forecasters to see meteorological phenomena in vivid detail. For example, in this loop, note how the top of the tornadic storm can be seen passing along the southern coast of Lake Pontchartrain.
Credit: NOAA/NASA
Note: This is preliminary, non-operational data as GOES-16 undergoes on-orbit testing.
http://www.youtube.com/watch?v=yqLBmaJeG-E [with comment]
*
Animation of GOES-16's Full Disk Channels
Published on Jan 23, 2017 by NOAASatellites
The animation of full disk images shows the continental United States in the two visible, four near-infrared and 10 infrared channels on ABI. These channels help forecasters distinguish between differences in the atmosphere like clouds, water vapor, smoke, ice and volcanic ash. GOES-16 has three-times more spectral channels than earlier generations of GOES satellites.
Credit: NOAA/NASA
The GOES-16 data posted on this page are preliminary, non-operational data and are undergoing on-orbit testing.
http://www.youtube.com/watch?v=6xfczXsEf1o [no comments yet]
*
GOES-16 Full Disk Animation
Published on Jan 23, 2017 by NOAASatellites
This composite color full-disk visible animation is from 1:07 p.m. EDT on January 15, 2017 and was created using several of the 16 spectral channels available on the GOES-16 Advanced Baseline Imager (ABI) instrument. Seen here are North and South America and the surrounding oceans.
GOES-16 observes Earth from an equatorial view approximately 22,300 miles high, creating full disk images like these, extending from the coast of West Africa, to Guam, and everything in between.
Credit: NOAA/NASA
The GOES-16 data posted on this page are preliminary, non-operational data and are undergoing on-orbit testing.
http://www.youtube.com/watch?v=hVymyJ9q5a0 [with comments]
--
in addition to (linked in) the post to which this is a reply and preceding and (other) following, see also (linked in):
http://investorshub.advfn.com/boards/read_msg.aspx?message_id=127963757 and preceding and following
http://investorshub.advfn.com/boards/read_msg.aspx?message_id=127997021 and preceding (and any future following)
http://investorshub.advfn.com/boards/read_msg.aspx?message_id=128018093 and following
http://investorshub.advfn.com/boards/read_msg.aspx?message_id=128039826 and preceding (and any future following)
http://investorshub.advfn.com/boards/read_msg.aspx?message_id=128117343 and preceding and following
http://investorshub.advfn.com/boards/read_msg.aspx?message_id=128305323 and preceding (and any future following)
http://investorshub.advfn.com/boards/read_msg.aspx?message_id=128447083 and preceding (and any future following)
http://investorshub.advfn.com/boards/read_msg.aspx?message_id=129013333 and preceding and following
http://investorshub.advfn.com/boards/read_msg.aspx?message_id=129024837 and preceding (and any future following)
http://investorshub.advfn.com/boards/read_msg.aspx?message_id=128907766 and preceding and following
http://investorshub.advfn.com/boards/read_msg.aspx?message_id=129105223 and preceding (and any future following)
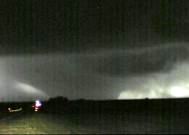
Greensburg, KS - 5/4/07
"Eternal vigilance is the price of Liberty."
from John Philpot Curran, Speech
upon the Right of Election, 1790
F6
Join the InvestorsHub Community
Register for free to join our community of investors and share your ideas. You will also get access to streaming quotes, interactive charts, trades, portfolio, live options flow and more tools.

