


Tuesday, March 07, 2017 9:18:45 AM
Nothing below but the continued declining volume and a daily short percentage that move to the middle of my desired range suggests the down leg is over. However, the oscillators being mixed with a couple improving does offer a suggestion of that. Combined with a "doji" candlestick pattern (indecision) that gives a bullish reversal 52% of the time (essentially random) and buy percentage being at low extremes that often sees a quick improvement following, we can surmise that a beginning of a leg up is not out of the question.
Today was essentially a long, wide spread, extremely low/no-volume flattish behavior through 14:28 followed by a step lower and another long, wide spread, extremely low/no-volume flattish behavior through 15:56. The EOD volatility that set the intra-day low of $0.73 at 15:59 gave us a close at $0.76, 4.11% above the last trade(s) of 15:59.
Today looked to me like almost nothing but MMs in the market. Fitting with that, the closing trade was flat with yesterday and was 4.11% above the last trades of 15:59. So it looks like were back to manipulation by the MMs to try and elevate prices so they can do the intra-day normal naked shorting at high prices and then lock in their profits as lower prices when the shorting engenders the usual result - lower price.
There were XXX pre-market trades.
B/a just before open was 2K:4K $0.73/$0.84.
09:30-11:51 was, unusually, a mostly extremely low/no-volume period almost from the get-go. The day opened with a 876 sell for $0.76 (no more trades until 9:34's 0dd-lot 28 $0.75/$0.7940/80 and then 9:44). B/a just after open was 2.5K:2 $0.75/9 (offers backed by presented 200 $0.80). Then came 9:32's b/a 2.5K:10 $0.75/7 (offers backed by presented 2 $0.79 and 300 $0.80), 9:35's 8:200 $0.79/$0.80 (bids backed by presented 2.5K $0.27), 9:43's b/a 2.5K:150 $0.75/8, 9:44's 1K $0.7512, 9:45's b/a 2.5K:350 $0.75/8, 9:47's 100 $0.77, 9:51's b/a 2.5K:300 $0.75/$0.7799, 9:52's 425 $0.7523/00, 10:03's 2.5K:200 $0.7500/$0.7799, 10:16 2.5K:400 $0.75/$0.7799, 10:19's 3K $0.75, 10:20's 100 $0.7699, 10:21's 8.1K $0.7508 (6.9K)/00 (1K)/$0.7699, 10:26's b/a 2K:729 $0.75/$0.7699, 10:26's 300 $0.7688, 10:34's b/a 2.1K:729 $0.75/$0.7699, 10:44's 1.1K $0.7547 (1K)/00, 10:45's b/a 7.2K:529 $0.75/$0.7699, 11:02's 7.2K:600 $0.7500/$0.7699, 11:05's 100 $0.75, 11:17 b/a 7.2K:600 $0.75/$0.7699, 11:31's 200 $0.76, 11:31 7.3K:800 $0.75/$0.7699, 11:46 7.3K:500 $0.75/$0.7650. The period ended on 11:51's 300 $0.75.
11:52-14:32 began with 19 no-trades minutes with b/a at 12:01 of 7.2K:400 $-/75/$0.7650. Trade began extremely low/no-volume $0.75/$0.7650 on 12:11's 600 $0.7850. B/a at 12:16 was 7.6K:400 $0.75/$0.7650, 12:31 7.4K:1.1K $0.7500/96. Volume and price were interrupted by 12:34's 9.2K $0.7500/$0.7495 (800)/$0.7517/$0.7495 (300) and 12:44's 5.7K $0.7499/00/10/02/10/75/38/75/00/99/$0.7501. B/a at 12:46 was 15.3K:700 $0.75/$0.7699, 13:01 15.3K:600 $0.75/$0.7699, 13:16 15.3K:600 $0.75/$0.7699, 13:31 200:700 $0.7501/$0.7699 (bids backed by presented15K $0.75). Price was interrupted by 13:41's 200 $0.7501/$0.766. B/a at 13:46 was 300:700 $0.7501/$0.7699. The period ended on 14:32's 4.7K $0.7500 (4.4K)/16/46.
14:33-15:57 began extremely low/no-volume $0.7410/$0.7573, with falling highs, after 14:33-:35's 16.6K $0.7500/01/00/01/25/00/$0.7410/$0.75/$0.7410/$0.75/$0.7495/$0.7410. B/a at 14:36 was 1.5K:400 $0.7410/$0.7593, 14:47 1.7K:900 $0.7410/$7593. Volume was interrupted by 15:14's 3.1K $0.7502/39. By 15:19 the highs were down to $0.7422 and by 15:41 up to $0.7432. Volume was interrupted by 15:48's 7.3K $0.7486/30 (6K)/10. The period ended on 15:57's 100 $0.7410.
15:58-16:00 began the EOD volatility on 15:58's 3.2K $0.7410 (1.9K)/$0.7301/$0.7410/00/50/00/41/00, and ended the period and day on 15:59's 5.6K $0.74/$0.7300/90/00 and 16:00's 477 $0.76, 4.11% above the last trade(s) of 15:59.
There was one odd-lot 70-share $0.73 AH sell.
Excluding the opening and closing trades (didn't qualify), there were 4 larger trades (>=5K) totaling 22,876, 25.98% of day's volume, with a $0.7484 VWAP. For the volume I guess the count is appropriate. The percentage of day's volume was in the normal range, for the price behavior anyway, range. The VWAP was only 1/100th of a penny above the day's $0.7483.
The VWAP moved consistently lower throughout the day, consistent with buy percentage being unable to show any positive movement. This is one of the items that make me think that almost nobody but MM bots were playing in the market today.Ending Period Period Period __Per. Trade_ Period_ % Day_ Per. End
Period Volume Low High _Dollar Val._ VWAP___ Volume Buy ~%
11:51 16172 $0.7500 $0.7700 $12,177.46 $0.7530 18.36% 9.95% Incl 10:21 $0.7508 6,875
14:32 32169 $0.7400 $0.7679 $24,150.80 $0.7507 36.53% 17.61%
15:57 29601 $0.7410 $0.7573 $22,111.13 $0.7470 33.61% 15.80% Incl 14:33 $0.7500 5,000 14:34 5,001
15:48 $0.7430 6,000
16:00 9215 $0.7300 $0.7600 $6,780.37 $0.7358 10.46% 16.39%
Sure makes my bullish take expecting a move up to challenge $0.83 look silly doesn't it? This is the second day of similar weakness in buy percentage and a falling VWAP. I noted at the time conflicting signals but I went with the preponderance, which was most were bullish. Se la vie!
Regardless, recall last time we saw buy percentages this low for a day or two I commented that a quick recovery to more normal ranges was common. That applies here as well and I wouldn't be surprised to see buy percentages improve and help push VWAP in the other direction.
On the traditional TA front, movements were:
Believe it or not, there's a positive buried in here! The continuing decline of the volume as the VWAP falls and these metrics weakens tells us there's no strength (yet?) in the move lower. This is another item making me think it's MMs just pushing the market around for their own profit, common when there's no real market sentiment to force them into servicing the market rather than defrauding it.__Open_ ___Low_ __High_ _Close_ Volume_
Today -5.00% -0.01% -3.51% 0.00% -42.85%
Prior 6.67% 0.01% -1.48% -1.17% -26.34%
On my minimal chart we see a continued flat low (four days), a falling high (2 days), and a flat close for two days, all within the consolidation triangle created by the descending resistance (red line) and the rising support, rising orange line. This is also the second day of declining volume, suggesting consolidation that should end this down leg within a few days. The nature of it's behavior at the ending is anyone's guess. It might break up, go sideways or hit a high-volume flush lower. If the latter behavior is seen I think the move would be small because that rising support has proven reliable thus far, including both very low and low-to-medium volume tests.
The fast EMA (yellow squiggly line) continues rising but is still below the slow EMA (squiggly blue line). The spread now is down to 6/100ths of a cent. We get a bullish indication when it crosses above and holds. As with yesterday, if we get any bullishness continuation over the next couple days we should get a bullish cross out of these EMAs.
Our trade range, which for two days almost completely filled the range of the experimental 13-period Bollinger band, filled only the lower half today. This range compression is typical of consolidation, bottoming, forming a base etc. It's especially common when volume is extremely low as the MMs have to tighten (and usually lower) the range just to get some trades done and make their money.
One new item of note today is the candlestick. We have a doji - open/close the same - which indicates indecision and gives a bullish reversal 52% of the time according to Bulkowski. That's pretty much random. Having said that, recall when I switched to near-term bullish two days back. Since then we've had an aggregate small price decline and large volume decline. The first day of that activity I thought might be "Friday effect" and said we need to wait a couple days and see what develops.
The volume decline, especially when combined with the very small VWAP decline from yesterday (see below), suggests no downward strength. ISTM that makes the doji candlestick more likely to be followed by a bullish reversal than a continued negative break.
We'll see.
On my one-year chart, the long-term descending resistance, which had closes above and on it the last two days, today had price close above it. yesterday when price closed right on the line I was not willing to call a confirmed breakout. I said with any luck we'll get that tomorrow. Got it. Today we are no longer constrained by that long-term resistance.
The 50 and 200-day SMAs continue falling. The 20-day SMA stopped declining and went absolutely flat. The 10-day continued to decline and the 10-day is still above the 20-day (39/100ths of a cent). A noted yesterday, the 10-day is a bit more likely to quickly get below the 20 if weakness appears. If we hold here we'll get 3 (was 4) days of declining 10-day SMA and again 4 days of rise. The 20-day would have 6 (was 1 day of decline) days of rise and seven (was six days of rise) days of decline. If we hold here the 50 will be flat one day, would decline 2 (was 4) days and then begin to rise for 22 (was 15) days, with a one-day interruption. The 200-day would fall ~120 (was ~165) days.
Yesterday the oscillators I watch had weakening in RSI (right at neutral), accumulation/distribution, Williams %R (below neutral) and ADX-related. Improvement occurred in MFI (above neutral and untrusted by me), momentum (just below neutral) and full stochastic (just above neutral).
Today had flat RSI and Williams %R, improvement in accumulation/distribution and full stochastic and deterioration in MFI (untrusted by me), momentum, and ADX-related.
The experimental 13-period Bollinger limits, $0.7253 and $0.8114 ($0.7264 and $0.8119 yesterday), continued converging. The mid-point is marginally rising as the lower limit rises more quickly than the upper limit declines.
All in, only the continuing declining volume could be considered vaguely bullish as it suggests no strength in the increasing negative indications. So using the above stuff I would lean towards consolidation. I would also lean towards "mild negative bias" but for the volume and the buy percentage being at extremes. These two cause me to want to say a reversal is the most likely next near-term move, but I don't have sufficient positive supporting indicators to go that way yet.
Percentages for daily short sales and buys moved in the same direction, a good thing, and the short percentage is about mid-point of my desired range (needs re-check). The buy percentage is in a range that says no near-term upside is likely, but as mentioned above it's quite common for this to quickly reverse and help reverse the VWAP movement. Can we rely on it happening right away? I don't think so. But my best SWAG would be that it starts to recover tomorrow.
The spread continued contracting and is now just a little above what I would expect in consolidation. I think suggests the down-leg is about over, especially when volume and the small VWAP movement are added in.
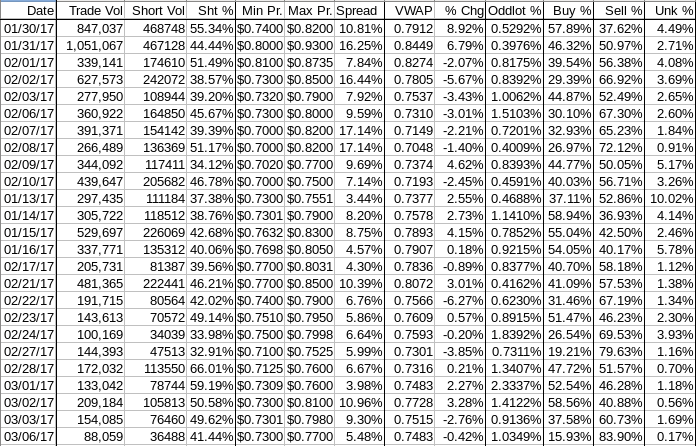
The VWAP's last twenty-four readings, which had held steady for seven days at 12 negative and 12 positive, deteriorated to 13 and 11 respectively. Change since 01/30 is -$0.0429, -5.42%, and the averages of the rolling 24-day period seen in the last few days (latest first) are now -0.1786%, 0.2106%, 0.3104%, 0.2341%, 0.2301%, 0.3382%, 0.4031%, 0.3941%, 0.2967%, and 0.4694%. The trend of the rolling average of change finally went negative today.
All in, the conflict between short percentage (sort of good) and the buy percentage (definitely bad) is resolved by the spread and volume to consolidation with a likely cessation of the move lower. Nothing yet indicating a move up.
Bill
Join the InvestorsHub Community
Register for free to join our community of investors and share your ideas. You will also get access to streaming quotes, interactive charts, trades, portfolio, live options flow and more tools.

