Sentiment: Investment Managers Very Bullish By Carl Swenlin
* February 26, 2017
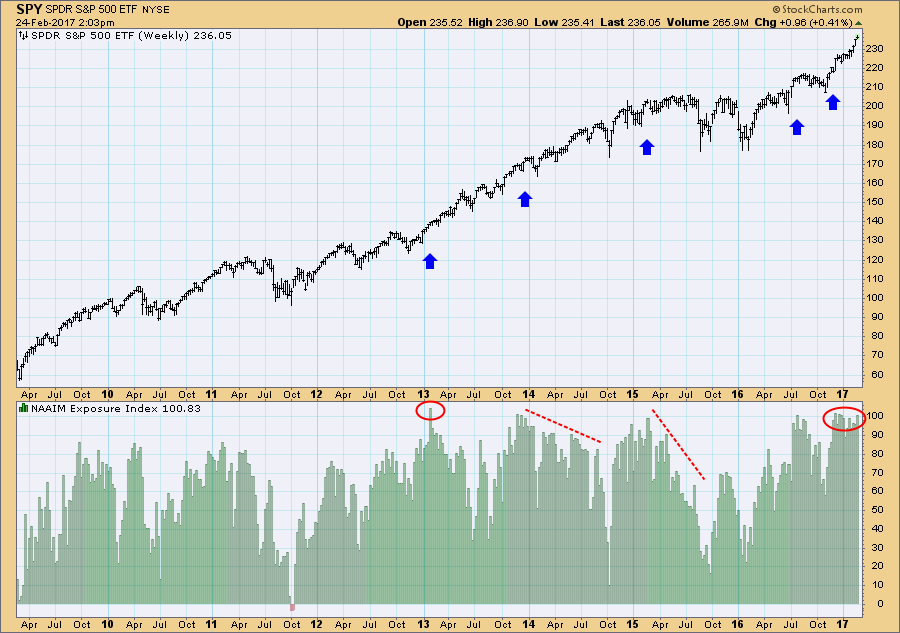
One of the sentiment indicators we follow is the Exposure Index (EI) for the National Association of Active Investment Managers (NAAIM). It is probably somewhat better than other measures of sentiment because it shows how professionals have actually deployed their assets. The far right of the chart shows a recent period of sustained exposure at very high levels. Since the rule of thumb with sentiment is that high levels of bullishness can be bearish for the market, is this a prelude to a price top?
The Exposure Index is not an expression of dollars exposed. Rather it shows the average percentage exposure of NAAIM members. Members are polled weekly in this regard, and the range of possible responses is as follows:
200% Leveraged Short 100% Fully Short 0% (100% Cash or Hedged to Market Neutral) 100% Fully Invested 200% Leveraged Long
In spite of this wide range of possibilities, the average exposure normally ranges between zero and 100%, and there have been only three times since 2006 (the year the EI was started) where exposure was slightly on the short side.
One of the things I wanted to point out is the fact that very high EI readings (blue up arrows) do not always signify a point of buying exhaustion that results in price correction. For example, the EI spike in early-2013 signaled a price advance that lasted almost two years. Also, in 2014 and 2015 the dotted lines show how, after initially high EI readings, exposure declined over several months before the price advances finally broke.
So how should we interpret the recent period of sustained high EI readings? In my opinion they are evidence of an initiation impulse that will continue to move prices higher -- not in a straight line higher, but overall higher. For example, last week I pointed out how extended SPY was from its 200EMA, and that condition still needs to be relieved. Yes, it is possible that a more negative outcome will emerge, but we are in a strong bull market, and we should temper our analysis and conclusions in that regard.
Technical Analysis is a windsock, not a crystal ball.
Happy Charting! - Carl
• DiscoverGold
Click on "In reply to", for Authors past commentaries
Information posted to this board is not meant to suggest any specific action, but to point out the technical signs that can help our readers make their own specific decisions. Your Due Dilegence is a must! • DiscoverGold
Register for free to join our community of investors and share your ideas. You will also get access to streaming quotes, interactive charts, trades, portfolio, live options flow and more tools.


 News
News  Market Data
  Discover