


Saturday, February 25, 2017 12:01:34 PM
Just to keep things in perspective…I periodically take a look at technical indicators just to keep aware of what may happen. I tend not to use moving averages and momentum indicators as I think they are so lagged that they’re essentially useless. I like to watch channels and support/resistance lines. They don’t tell us which way the price is going to go, but rather serve as a confirmation once a breakout is achieved and indicate potential price pivot points. I learned the “trend is your friend” back when I used to actively trade copper futures.
Comments:
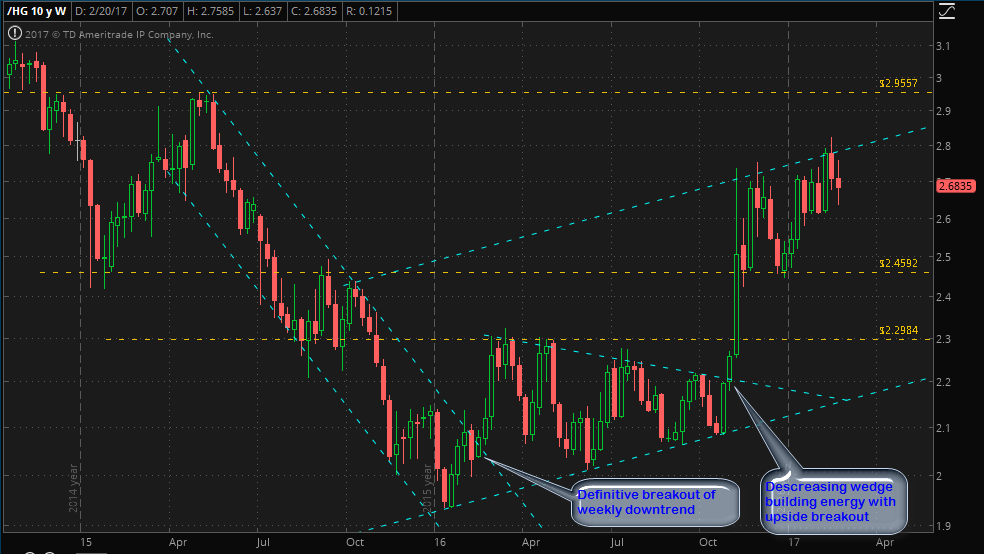
1. We witnessed a definitive breakout of the weekly downtrend back on 2/22/16. This was a strong indicator that the previous bear market in copper was ending and switching over to a bull market.
2. A decreasing wedge developed from March to October of 2016. Decreasing wedges indicate that energy is building in the price movement. Think of a coiled spring. When a breakout does occur, it typically does so dramatically releasing the stored energy. Sure enough, when it broke to the upside at the beginning of November 2016, it did so with a vengeance.
3. I had drawn the price support/resistance line at 2.4592 before Cu made its move back in Oct-Nov 2016. It’s interesting to see that this line became support after copper broke out of the previous trading range. The price has come down and tested this line twice since breaking out. Classic case of previous resistance becoming new support.
4. Weekly copper is now trading in a broad positive sloping channel. I fully expect copper to continue the upward trend, but I would not be shocked if Copper went back down to test the 2.20 range again. Very unhappy, but not shocked.
5. Next level of resistance will be the high of May 2015 at 2.9557. If we see copper continue to follow the upward weekly channel, it will most likely stall at 2.9557. Time will tell if it breaks through and progresses to the next price levels or remains in the existing trading channel.
Bantec Reports an Over 50 Percent Increase in Sales and Profits in Q1 2024 from Q1 2023 • BANT • Apr 25, 2024 10:00 AM
Cannabix's Breath Logix Alcohol Device Delivers Positive Impact to Private Monitoring Agency in Montana, USA • BLO • Apr 25, 2024 8:52 AM
Kona Gold Beverages, Inc. Announces Name Change to NuVibe, Inc. and Initiation of Ticker Symbol Application Process • KGKG • Apr 25, 2024 8:30 AM
Axis Technologies Group and Carbonis Forge Ahead with New Digital Carbon Credit Technology • AXTG • Apr 24, 2024 3:00 AM
North Bay Resources Announces Successful Equipment Test at Bishop Gold Mill, Inyo County, California • NBRI • Apr 23, 2024 9:41 AM
Epazz, Inc.: CryObo, Inc. solar Bitcoin operations will issue tokens • EPAZ • Apr 23, 2024 9:20 AM

