


Wednesday, February 22, 2017 11:36:00 AM
Today's stuff leaves my assessment unchanged - most likely near-term is weakness as we enter a consolidation down-leg. There are definitely conflicting signals here though. I ameliorate their effects by use of my TFH - I apply the manipulation thesis to resolve the conflicts!
 This may be illogical though.
 From the open. it was obvious that someone was forcing buyers in at higher prices as right after open was 20K:228 $0.80/1 and by 9:45 it was 32.8K:528 $0.80/1. It was effective as prices were forced up quickly. Sure enough, check what happened in the period ending 11:26.
There were no pre-market trades.
B/a just before open was 1K:200 $0.76/$0.80.
09:30-10:04 opened the day with a 14,684 buy for $0.80 & $0.80 x 600, $0.79 x 100, $0.80 x 200, x 100. B/a just after open was 20K:228 $0.80/1. Then came 9:34's 100 $0.8004, 9:35's b/a 20K:428 $0.80/1, 9:36's 5.1K $0.8010/04/11/00, 9:37's 300 $0.8000/10, 9:38's 100 $0.80, 9:39's 200 $0.80, 9:42's 200 $0.8010/00, 9:45's b/a 32.8K:528 $0.80/1, 9:45's 100 $0.80, 9:46's 200 $0.8010/00, 09:53's 33.3K:1.2K $0.8000/49, 9:54's b/a 33.3K:100 $0.8000/11, 9:54's 1.5K $0.8011/17/49/18/50/20/$0.81/$0.8020/$0.81/$0.83 (428), 09:55's 100 $0.8010, 9:56's b/a 35.4K:45 $0.80/2 (offers backed by presented 6.2K $0.83), 9:56's 100 $0.8012, 9:57's 100 $0.8015, 9:58's 200 $0.8015/$0.8280, 9:59's 100 $0.8016, 10:01's 100 $0.8255, 10:02's b/a 300:6K $0.81/3, 10:02's 450 $0.8278/99, 10:03's 100 $0.81, and the period ended on 10:04's 200 $0.81
10:05-11:18 stepped up, beginning on 10:07's 32K $0.8300/18/90/$0.84/$0.85/$0.81 and 10:08's $0.85/2, to begin very low-volume $0.8201/$0.8470 through 10:16. Then began extremely low/no-volume $0.8201/$0.8465, with falling highs. B/a at 10:17 was 600:7.3K $0.8201/$0.8470. Volume was interrupted by 10:27's 18.8K $0.8226/99/$0.8300/11/$0.8470 (10K blk)/$0.8352 and volume switched to mostly low volume. Volume was again interrupted by 10:41's 22.2K $0.8230/26/30/25/18/25/26/25/17/16/01. B/a at 10:27 was 500:8.3K $0.8216/$0.8470, 10:32 900:8.2K $0.8216/$0.8470, 10:44 300:2.1K $0.8202/97, 10:47 800::2.2K $0.8202/97, 10:02 1.6K:600 $0.8230/90, 11:17 100:3.5K $0.8202/82 (offers falling rapidly). The period ended on 11:18's 5.6K $0.8201/76/75.
11:19-11:26 began a large, high-volume (almost equal to all prior volume) drop on 11:19's 6K $0.8274/00/72/16/00. 11:22's 35.3K did $0.8200/01/$0.8188, 11:24's 13K hit $0.8100/01/$0.8016, 11:25's 37.6K hit $0.8020/00, and the period ended on 11:26's 39K $0.80/$0.79.
11:27-13:44 bounced up in the first eight minutes, on an aggregate ~10K, to begin extremely low/no-volume $0.80/$0.8188 (falling to $0.8186 over time). B/a at 11:33 was 2.5K:1.3K $0.8000/88, 11:50 2.2K:1.4K $0.8001/$0.8188. Volume was interrupted by 11:55's 6K $0.8001/$0.8188 and 11:57's 7.3K $0.8001/$0.8185. B/a at 12:02 was 3.2K:320 $0.8001/$0.8186, 12:17 3.3K:420 $0.8001/$0.8186. Volume was interrupted by 12:26's 15.9K $0.8001/$0.8186. B/a at 12:33 was 3.2K:320 $0.8001/$0.8186, 12:47 3.1K:220 $0.8001/$0.8186, 13:02 3K:420 $0.8001/$0.8106. Volume was interrupted by 13:02's 5.2K $0.8001/$0.8193 and b/a went to 4K:1.2K $0.8001/$0.8290, 13:17 4K:1.3K $0.8001/$0.8290, 13:32 4K:1.3K $0.8001/$0.8290. The period ended on 13:44's 200 $0.8011/$0.8136.
13:45-15:32 began extremely low/no-volume $0.79/$0.8063 (highs $0.80 14:34 on) after a mostly extremely low/no-volume bounce up and back down and doing another drop, beginning with 13:45's 100 $0.829. B/a at 13:47 was 4K:1.2K $0.8001/$0.8290. 13:53's 100 hit $0.81 and 13:55's 5.7K did $0.81/$0.8001. That instituted extremely low/no-volume $0.8001 until the next drop began. B/a at 14:02 was 500:4.6K $0.8001/91. The next drop was 14:11's 4.9K $0.8001/00/$0.79. B/a at 14:15 was 8.9K:200 $0.79/$0.8067. Highs dropped to $0.80 and continued slowly falling beginning at 14:34. B/a at 14:35 was 700:4.2K $0.7925/$0.80, 14:47 600:3.5K $0.7925/$0.80, 15:02 3.2K:2.9K $0.7905/89 (offers falling), 15:17 2.7K:3.5K $0.7905/91, 15:32 11.7K:1K $0.7900/1. The period ended on 15:32's 300 $0.79.
15:33-16:00 began the EOD volatility as trading first did a relatively large, rapid and higher-volume drop on 15:33's 11.6K $0.79->$0.7899, 15:34's 112 $0.78, 15:35's 4.6K $0.7800/92/00, and 15:36's 300 0.7700/97/00. That began low/medium/high-volume $0.77/8 (with lows rising 15:51 onward). B/a at 15:42 was 18K:16.7K $0.77/8, 15:49 10.95K:200 $0.77/8, 15:52 200:700 $0.7751/$0.78, 15:53 2.2K 800 $0.7751/$0.78 (bids jiggling 51/52), 15:59 4.4K:100 $0.77/9. The period and day ended on 15:58's (no trades 15:59) $0.7751/50/00 (10K blk)/$0.78, 15:59's 37 (odd-lot) $0.77 and 16:00's 352 $0.77 sell.
There were no AH trades.
Including the opening trade (closing didn't qualify), there were 33 larger trades (>=5K & 12 4K+) totaling 229,452, 47.67% of day's volume, with a $0.8061 VWAP. Excluding the opening trade, there were 32 larger trades totaling 214,768, 44.62% of day's volume, with a $0.8065 VWAP. The count seems reasonable for the volume but the percentages are quite high. Both sets had VWAPs below the day's $0.8072. With the count and sizes (quite a few "larger larger trades") combined with recent VWAPs rising this is starting to look like market sentiment has turned bullish, contrary to yesterday's overall assessment. Adding in volume up ~277% today and it looks like this move may have some legs.
Note the buy percentage change in the six minutes 11:19-:26 on 137,744 shares, ~84% of all prior volume, seems to suggest that the early strength was a "set up" for an MM's "good customer" to exit a position at a very attractive price. In spite of the larger trades indicating bullishness, we see that the buy percentage indicates "selling into strength". The buy percentage did try to recover after that though, so there is some bullishness. The selling, other than that notable period, could be just shorters and/or MMs. Note the VWAP held up well, regardless of falling buy percentage, until the last period. That period may have shown the effects of day traders exiting their positions?Ending Period Period Period __Per. Trade_ Period_ % Day_ Per. End
Period Volume Low High _Dollar Val._ VWAP___ Volume Buy ~%
10:04 49840 $0.7900 $0.8300 $39,922.36 $0.8010 10.35% 44.62% Incl 09:30 $0.8000 14,684 09:49 20,000
11:18 113375 $0.8100 $0.8500 $94,074.97 $0.8298 23.55% 52.58% Incl 10:07 4,000 $0.8300 $0.8500
10:07 $0.8400 10,000 10:27 $0.8300 4,000
10:27 $0.8470 10,000 10:31 $0.8335 7,000
10:38 $0.8216 4,400 10:41 4,696
11:18 $0.8201 5,000
11:26 137306 $0.7900 $0.8274 $110,934.30 $0.8079 28.52% 31.13% Incl 11:19 $0.8200 5,900 11:22 $0.8200 6,171
11:22 $0.8200 10,805 11:25 $0.8000 7,653
11:26 $0.8000 7,156 12,500 9,271
13:44 63042 $0.7900 $0.8193 $51,044.93 $0.8097 13.10% 37.80% Incl 11:30 $0.7985 4,625 11:57 $0.8185 7,062
12:26 $0.8186 7,500
15:32 44406 $0.7900 $0.8290 $35,341.69 $0.7959 9.23% 37.51% Incl 14:51 5,000 $0.7905 $0.7913
15:31 $0.7901 4,050
16:00 71401 $0.7700 $0.7900 $55,630.92 $0.7791 14.83% 41.06% Incl 15:33 $0.7900 7,794 15:35 $0.7800 4,000
15:43 $0.7800 4,000 4,000 4,000 4,000
15:52 $0.7799 5,900 15:54 $0.7752 5,285
15:58 $0.7700 10,000
On the traditional TA front, movements were:
This is the third consecutive day with an open at $0.80 and a flat low, $0.7698 and two $0.77. After two days of highs ~$0.80 ($0.8050, $0.8031) we got a $0.85. It was during the first 45 minutes though. The close, although low at $0.77, was not out of line with the late trading, $0.77 15:58 and one odd-lot $0.78 15:59.__Open_ ___Low_ __High_ _Close_ Volume_
Today 0.00% 0.00% 5.84% -3.75% 133.98%
Prior 0.00% 0.03% -0.24% 1.91% -39.09%
For this reason I suspect that the $0.77 close, down almost 4%, may be a better indication of what's next than the other bullish indications, which have been heavily influenced by what I thought was manipulation, as you know. Regardless of that, if the market really has become "believers" in $CPST, the longer-term trend could easily be upward.
On my minimal chart yesterday I said { ... There was also the new, very short-term, rising green line, a potential trend support (although my "three-day window" would suggest it was destined to not be a support). About 80% of our price range was below that line and the close was barely above it. The VWAP today, $0.7907, being substantially below that line (est. ~$0.8020 today) tells the true story.
With volume weakening two consecutive days and only MM actions giving us higher opens and closes I expect we'll drop below that green line completely tomorrow. }
Today price challenged all three lines and was rejected by each as the close was below all three lines. The really nasty part is this occurred on rising volume, up ~276%. In combination, this would suggest near-term most likely move would be lower, fitting with my (a bit too early call by a day?) for entering consolidation with a downward leg beginning.
I have to admit other factors make that seem like a risky position ATM.
The fast EMA is still above the slow EMA though but ceased rising and has begun to drop. Unlike the last couple days of { ... don't give it too much weight in your decision-making right now - the falling, and very low volume, make all such indicators suspect }, with today's volume we do have to give it weight, but watching for it to become a trend.
I'm holding, for now anyway, to yesterday's { Looking at the chart it would be easy to expect a test of $0.70 again, but we have a rising trend line (rising orange line) that should keep us up around $0.72/3 if it holds. }
On my one-year chart the 50 and 200-day SMAs continue falling. The 20-day SMA continued the small rise begun three days back. The 10-day made a small rise for the third day. If we hold here we'll get 6 days (was 7) of rising 10-day SMA. The 20-day would have 4 (was 5) days of rise and a return to descending for 2 (was 3) days and then would begin rising for 9 (again) days. If we hold here the 50 would decline 8 (was 8) days, and the 200-day would fall ~130 days.
Yesterday the oscillators I watch had improvement in RSI, accumulation/distribution, MFI (untrusted by me), momentum, Williams %R, and full stochastic. Weakening occurred in ADX-related. RSI and full stochastic are just below overbought condition.
Today had weakening in RSI, accumulation/distribution, momentum, Williams %R, and full stochastic. Improvement occurred in MFI (untrusted by me) and ADX-related. Short form is most of yesterday's improving oscillators went negative. RSI, MFI, momentum and full stochastic are above neutral, ADX-related is about neutral and the rest are below neutral.
The experimental 13-period Bollinger limits, $0.6970 and $0.8150 ($0.6834 and $0.8417 yesterday), continued converging and continued a marginally declining mid-point.
All in, the intra-day breakdown, larger trades and rising volume would suggest we have some bullishness, if not for the view that we've been manipulated. The conventional TA stuff suggests the opposite as the oscillators weakened, mostly, and the close was lower on substantially increasing volume, suggesting strong downward momentum.
Since I've been expecting entry to consolidation with a down-leg beginning, to this point I'm going to hang with that until both my intra-day stuff and conventional stuff are more-or-less in agreement.
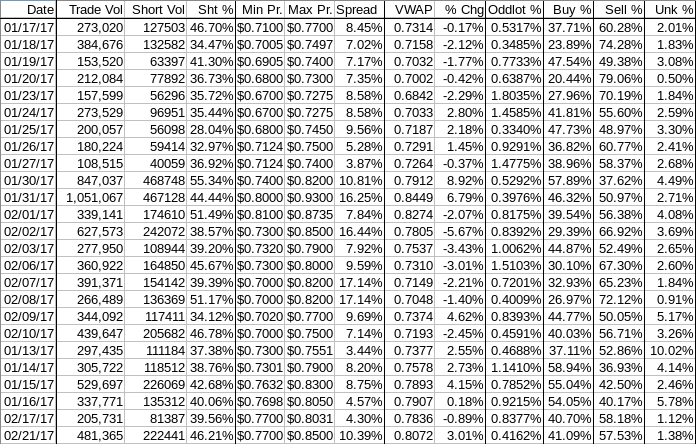
Percentages for daily short sales and buys moved in the same direction, good, but the short percentage went above my desired range (needs re-check) while the buy percentage was essentially flat and remained in a range that strongly suggests near-term weakness as most likely.
The spread got wide and since I believe we are entering a down-leg seems to support more downside as the most likely near-term result.
The VWAP's last twenty-four readings improved, after four consecutive days, from 14 negative and 10 positives to 13 and 11 respectively. Change since 01/17 is $0.0758, 10.37%, and the averages of the rolling 24-day period seen in the last few days (latest first) are now 0.4694%, 0.3371%, 0.2502%, 0.2845%, 0.2139%, 0.0172%, -0.1548%, -0.1396%, and -0.2936%. As mentioned, although it's been nice seeing six positive numbers, since three of the five oldest readings were relatively large negative moves, as they fall out of the window we could continue to see positive moves if our negative moves are relatively benign in size. "Negative moves"? Yes. Since we are out of the three-day window and seem to be returning to trend, with an expected-by-me negative bias, that seems a fair guess.
All in, most likely near-term is weakness based on this unconventional stuff.
Bill
Join the InvestorsHub Community
Register for free to join our community of investors and share your ideas. You will also get access to streaming quotes, interactive charts, trades, portfolio, live options flow and more tools.

