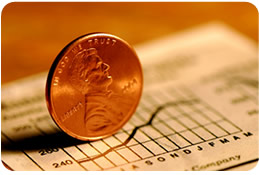
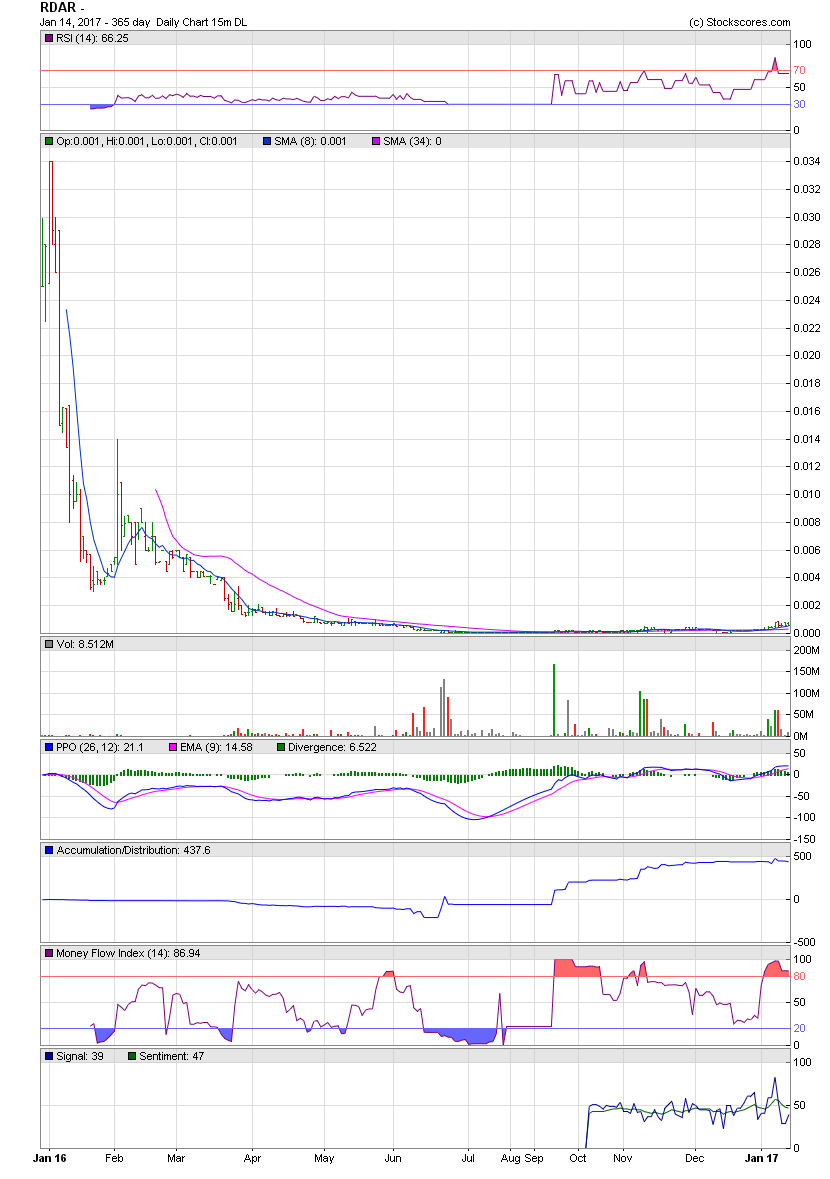
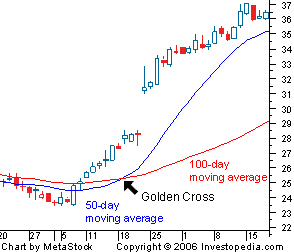
RDAR - Starting like ICNB RDAR - Bound for Pennyland ! RDAR - ICNB - Weekly Golden Cross What is a ' Golden Cross ' http://www.investopedia.com/terms/g/goldencross.asp?o=40186&l=dir&qsrc=999&qo=investopediaSiteSearch Daily / Weekly Charts RDAR - Targets 0.0018 / 0.004 / $0.01 / $0.02 http://investorshub.advfn.com/boards/read_msg.aspx?message_id=128821689 ICNB - Alerted at 0.0001 - Climbs to $0.034 http://investorshub.advfn.com/boards/read_msg.aspx?message_id=128190801 http://investorshub.advfn.com/boards/read_msg.aspx?message_id=127870237 http://investorshub.advfn.com/boards/read_msg.aspx?message_id=127697500 http://investorshub.advfn.com/boards/read_msg.aspx?message_id=127408920 ________________________________________________________________ http://investorshub.advfn.com/uimage/uploads/2016/12/1/nqbgxPenny_picture.jpg https://www.stockscores.com/chart.asp?TickerSymbol=ICNB&TimeRange=365&Interval=d&Volume=1&ChartType=OHLC&Stockscores=1&ChartWidth=830&ChartHeight=500&LogScale=None&Band=None&avgType1=SMA&movAvg1=8&avgType2=SMA&movAvg2=34&Indicator1=RSI&Indicator2=PPO&Indicator3=AccDist&Indicator4=MFI&endDate=&CompareWith=&entryPrice=&stopLossPrice= https://investorshub.advfn.com/uimage/uploads/2017/1/14/saeymRDAR_Jan_14_Chart_2.png https://www.stockscores.com/chart.asp?TickerSymbol=ICNB&TimeRange=365&Interval=d&Volume=1&ChartType=OHLC&Stockscores=1&ChartWidth=830&ChartHeight=500&LogScale=None&Band=None&avgType1=SMA&movAvg1=8&avgType2=SMA&movAvg2=34&Indicator1=RSI&Indicator2=PPO&Indicator3=AccDist&Indicator4=MFI&endDate=&CompareWith=&entryPrice=&stopLossPrice= https://www.stockscores.com/chart.asp?TickerSymbol=RDAR&TimeRange=365&Interval=d&Volume=1&ChartType=OHLC&Stockscores=1&ChartWidth=830&ChartHeight=500&LogScale=None&Band=None&avgType1=SMA&movAvg1=8&avgType2=SMA&movAvg2=34&Indicator1=RSI&Indicator2=PPO&Indicator3=AccDist&Indicator4=MFI&endDate=&CompareWith=&entryPrice=&stopLossPrice= http://i.investopedia.com/inv/dictionary/terms/GoldenCross.gif https://www.stockscores.com/chart.asp?TickerSymbol=ICNB&TimeRange=365&Interval=w&Volume=1&ChartType=OHLC&Stockscores=1&ChartWidth=830&ChartHeight=500&LogScale=None&Band=None&avgType1=SMA&movAvg1=8&avgType2=SMA&movAvg2=34&Indicator1=RSI&Indicator2=PPO&Indicator3=AccDist&Indicator4=MFI&endDate=&CompareWith=&entryPrice=&stopLossPrice= https://www.stockscores.com/chart.asp?TickerSymbol=RDAR&TimeRange=365&Interval=w&Volume=1&ChartType=OHLC&Stockscores=1&ChartWidth=830&ChartHeight=500&LogScale=None&Band=None&avgType1=SMA&movAvg1=8&avgType2=SMA&movAvg2=34&Indicator1=RSI&Indicator2=PPO&Indicator3=AccDist&Indicator4=MFI&endDate=&CompareWith=&entryPrice=&stopLossPrice=
 News
News  Market Data
  Discover