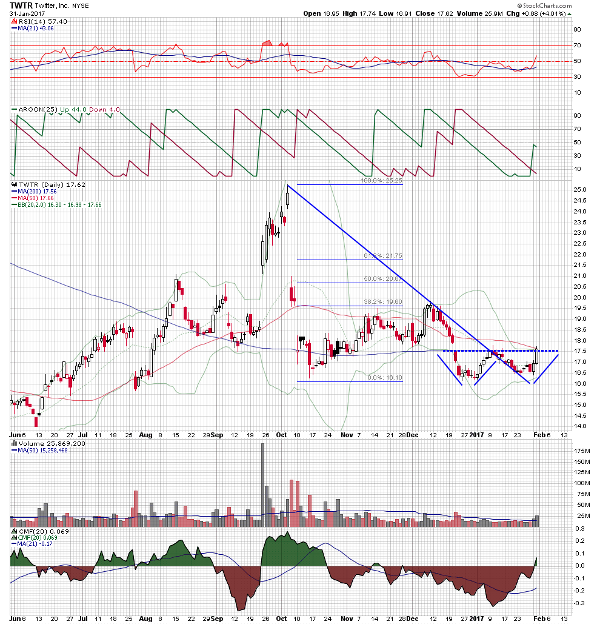
The daily chart shows the sharp drop in price last October, which was highlighted by two wide gaps lower. Over the next two months, it was able to move off the low and close the lower gap, briefly retaking its 50-day moving average. The attempt to make higher lows failed going into the end of the year, and the stock moved back below the 50-day average and continued down through the 200-day average.
Since that time, it has formed a "W" shaped bottoming pattern below resistance in the $17.50 area, which is the intersection of the two moving averages, a horizontal resistance level, and the upper Bollinger band.
The relative strength index has moved back up above its center line, reflecting recent positive price momentum. The aroon indicator -- a momentum indicator based on time relative to price rather than price relative to time, meaning it identifies new highs and early shifts in trend -- is making a bullish crossover. Chaikin money flow is in positive territory for the first time since November 2016, and is suggesting renewed buying interest in the stock.
Register for free to join our community of investors and share your ideas. You will also get access to streaming quotes, interactive charts, trades, portfolio, live options flow and more tools.
 News
News  Market Data
  Discover