


| Followers | 679 |
| Posts | 140877 |
| Boards Moderated | 36 |
| Alias Born | 03/10/2004 |
Friday, January 27, 2017 8:07:48 AM
By Erin Heim
* January 26, 2017
My viewer wrote to me:
"UNG is looking interesting at least short term with a target price of 9.40 to 9.60 area. PMO increasing and about to possibly cross zero line. Broken above all moving averages. SCTR & on balance volume improving."
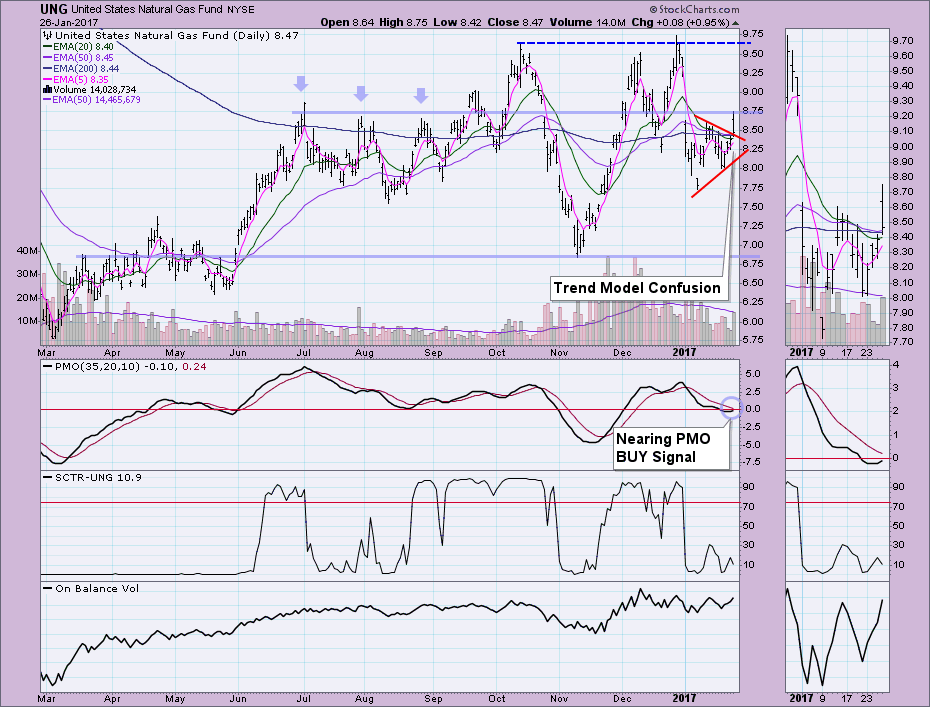
The email arrived this morning before the spectacular move and close. Good catch, my friend! However, there are negatives here in addition to the positives. The DecisionPoint Trend Models are based on 5/20/50/200-EMA crossovers. Currently those models are simply unhelpful. When the EMAs braid and thin their margins among each other, those crossovers can easily become whipsaw signals. Currently, the 50-EMA is above the 200-EMA which technically puts UNG in a bull market configuration but the margin between the two is .01. The SCTR was improving but until I see a reading above the January top, I don't think it is giving us bullish information just yet. The best parts of this chart are the rising Price Momentum Oscillator (PMO) which will likely trigger a BUY signal soon and the breakout from the short-term symmetrical triangle. Those patterns are typically continuation patterns and really called for a breakdown to continue the fall from the December high, but instead it broke out. It's reached resistance at $8.75, but the OBV is confirming the breakout with a reading above the previous top.
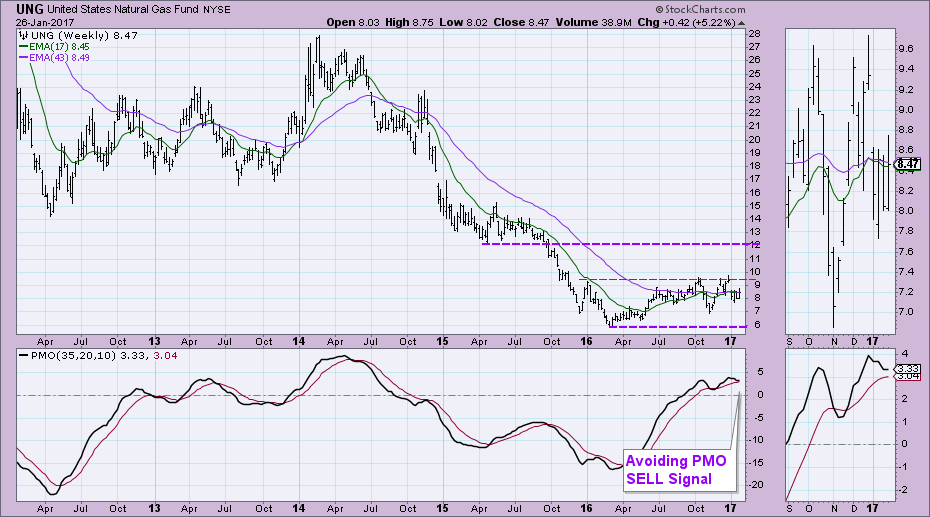
More information can be gained looking at the weekly chart. The PMO is not quite as bullish on the weekly chart. It so far has been avoiding a SELL signal which is bullish and it is rising. $9.50 looks like a reasonable target price, but a strong rally could propel UNG to the $12. Indicators aren't quite bullish enough to call for that; for example, the 17-week EMA is still below the 43-week EMA.
Conclusion: To my reader and viewer: You analyzed the chart well. I think a target price to the top of the price channel denoted on the weekly chart around $9.50 is a good one. There is potential for more, but given the somewhat mixed indicator information, I think that $9.50 is sensible.
Technical Analysis is a windsock, not a crystal ball.
Happy Charting!
- Erin
http://stockcharts.com/articles/decisionpoint/2017/01/natural-gas-ung-analysis-request---heating-up.html
• DiscoverGold
Click on "In reply to", for Authors past commentaries
Information posted to this board is not meant to suggest any specific action, but to point out the technical signs that can help our readers make their own specific decisions. Your Due Dilegence is a must!
• DiscoverGold
Bantec Reports an Over 50 Percent Increase in Sales and Profits in Q1 2024 from Q1 2023 • BANT • Apr 25, 2024 10:00 AM
Cannabix's Breath Logix Alcohol Device Delivers Positive Impact to Private Monitoring Agency in Montana, USA • BLO • Apr 25, 2024 8:52 AM
Kona Gold Beverages, Inc. Announces Name Change to NuVibe, Inc. and Initiation of Ticker Symbol Application Process • KGKG • Apr 25, 2024 8:30 AM
Axis Technologies Group and Carbonis Forge Ahead with New Digital Carbon Credit Technology • AXTG • Apr 24, 2024 3:00 AM
North Bay Resources Announces Successful Equipment Test at Bishop Gold Mill, Inyo County, California • NBRI • Apr 23, 2024 9:41 AM
Epazz, Inc.: CryObo, Inc. solar Bitcoin operations will issue tokens • EPAZ • Apr 23, 2024 9:20 AM

