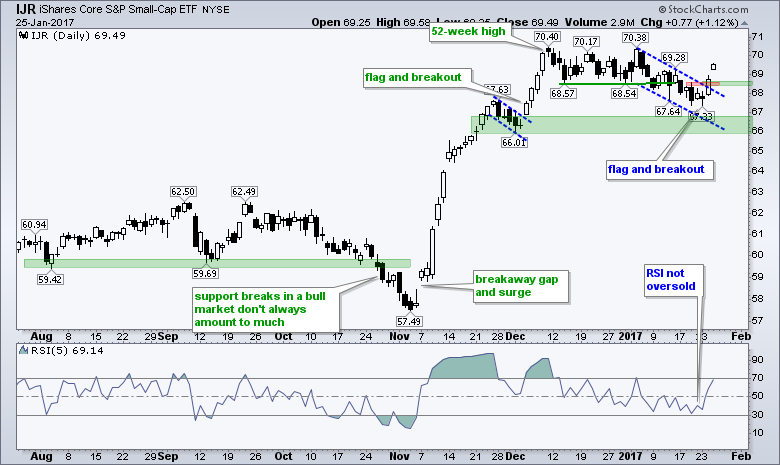
The S&P SmallCap iShares (IJR) was lagging this year because it corrected with a falling flag. RSI dipped to 32.18 last week, but did not become "oversold". Sometimes RSI does not fully cooperate and provide a nice oversold signal. This is when I look to the price chart for clues. First and foremost, the pullback over the last few weeks was always viewed as a correction within a bigger uptrend. IJR closed below 68 with a black candlestick last Thursday, firmed on Friday-Monday and then broke out on Monday. This is a four-candlestick reversal pattern - decline, stall and reverse. The breakout zone becomes the first area to watch for a failure. Thus, I think a close below 68.2 would call for a reassessment.
Register for free to join our community of investors and share your ideas. You will also get access to streaming quotes, interactive charts, trades, portfolio, live options flow and more tools.
 News
News  Market Data
  Discover