


| Followers | 504 |
| Posts | 10140 |
| Boards Moderated | 0 |
| Alias Born | 04/28/2014 |
Friday, January 20, 2017 11:01:41 PM
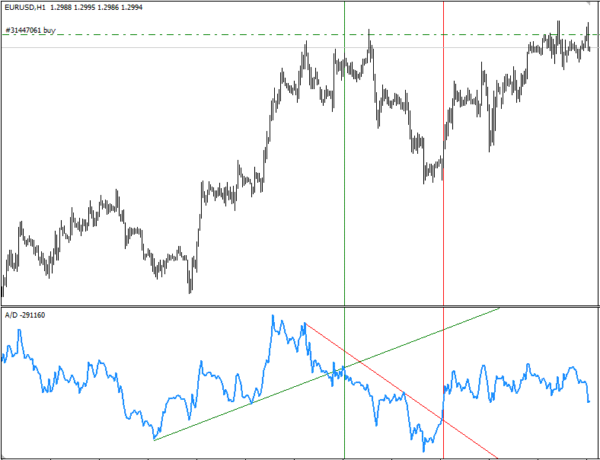
Now applying the same technique to GYOG we see that indeed the accumulation/distribution indicator has crossed above its trend line.
This is just one more key piece of evidence that suggests to me the bottom is in and the chart is resuming its uptrend.
An uptrend is basically made of higher highs with higher lows, so this certainly is starting to follow that definition.

North Bay Resources Commences Operations at Bishop Gold Mill, Inyo County, California; Engages Sabean Group Management Consulting • NBRI • Sep 25, 2024 9:15 AM
CEO David B. Dorwart Anticipates a Bright Future at Good Gaming Inc. Through His Most Recent Shareholder Update • GMER • Sep 25, 2024 8:30 AM
Cannabix Technologies and Omega Laboratories Inc. Advance Marijuana Breathalyzer Technology - Dr. Bruce Goldberger to Present at Society of Forensic Toxicologists Conference • BLOZF • Sep 24, 2024 8:50 AM
Integrated Ventures, Inc Announces Strategic Partnership For GLP-1 (Semaglutide) Procurement Through MedWell USA, LLC. • INTV • Sep 24, 2024 8:45 AM
Avant Technologies Accelerates Creation of AI-Powered Platform to Revolutionize Patient Care • AVAI • Sep 24, 2024 8:00 AM
VHAI - Vocodia Partners with Leading Political Super PACs to Revolutionize Fundraising Efforts • VHAI • Sep 19, 2024 11:48 AM

