


Monday, January 16, 2017 10:34:47 PM
SEE CHART:
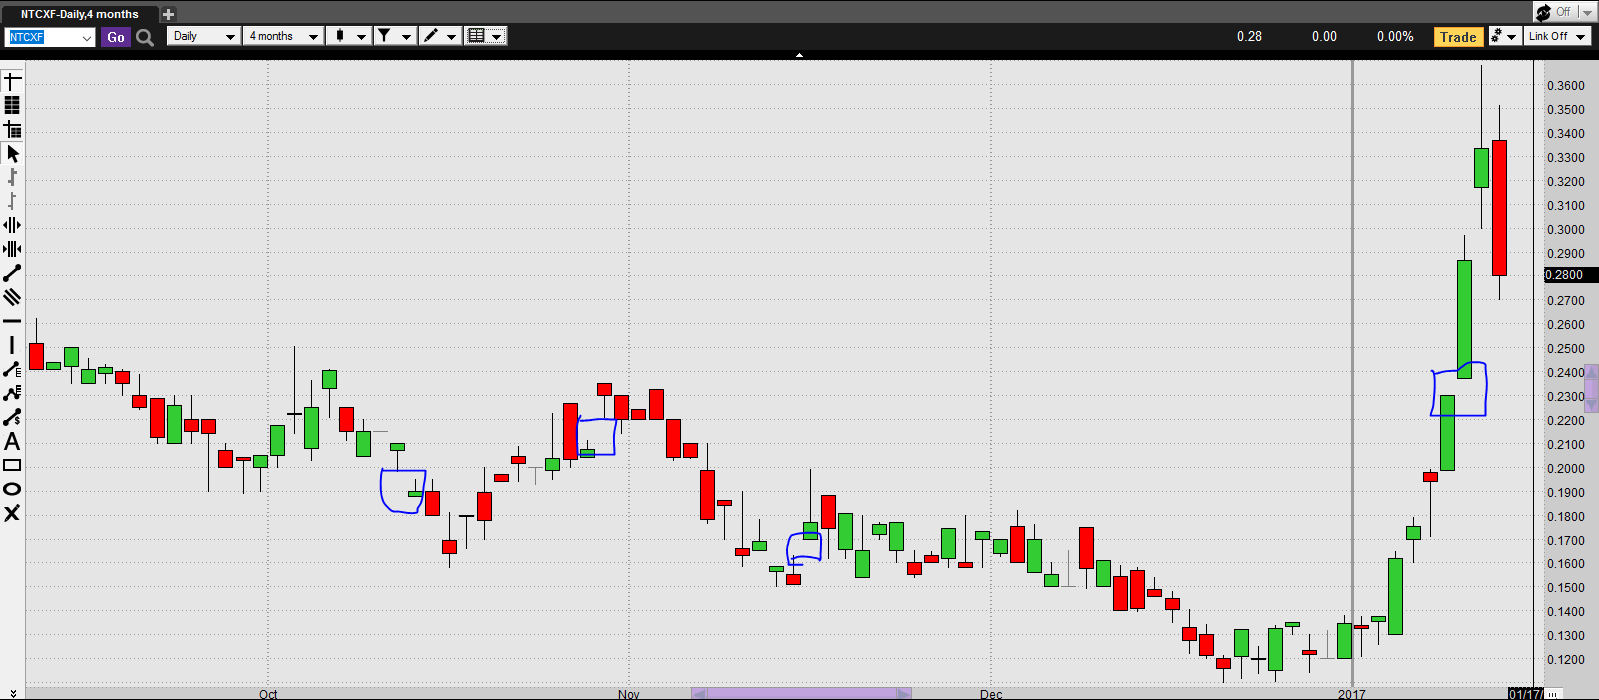
That coupled with the fact that the RSI is coming off of the critical high level above 70, now going through a reset, currently at 68.06
Simple Moving Average (SMA)
NTCXF is trading above its 50 day simple moving average. This is considered to be the sign of a bullish trend. There is added weight to this indication because the moving average is rising and suggests that there has been buying interest in this stock.
Exponential Moving Average (EMA)
On Tuesday, NTCXF closed above its 200 day exponential moving average. This is generally considered to be an indication of a bullish trend.
Bollinger Bands ®
NTCXF is presently near its upper Bollinger Band. This suggests that it is at a high level relative to recent action.
Moving Average Convergence Divergence(MACD)
The MACD for NTCXF currently indicates a strong bullish signal for two reasons. First, the MACD is above the signal line, a 9-day moving average. Second, the MACD is above 0 which implies that the underlying moving averages are trending higher.
Relative Strength Index (RSI)
The RSI recently dropped to 68.06 from above the critical level of 70. This signals that NTCXF is no longer overbought and the internal strength of the stock appears to be waning.
Slow Stochastics
The Stochastic Oscillator is registering a bearish signal as the %K line has crossed under the %D and the oscillator recently crossed below the critical value of 80, moving from its overbought indication.
Fast Stochastics
The Stochastic Oscillator is registering a weak bearish signal as the %K line has crossed under the %D. However, the oscillator is currently above the critical value of 80, indicating NTCXF as being overbought. An overbought condition suggests that the recent upwards momentum is not sustainable. The oscillator moving below 80 will increase the bearishness of this signal.
Looking for an entry point any where near or around that area +/- 1-2 cent points............................WE WILL SEE.
GO NTCXF
"PEACE"
VHAI - Vocodia Partners with Leading Political Super PACs to Revolutionize Fundraising Efforts • VHAI • Sep 19, 2024 11:48 AM
Dear Cashmere Group Holding Co. AKA Swifty Global Signs Binding Letter of Intent to be Acquired by Signing Day Sports • DRCR • Sep 19, 2024 10:26 AM
HealthLynked Launches Virtual Urgent Care Through Partnership with Lyric Health. • HLYK • Sep 19, 2024 8:00 AM
Element79 Gold Corp. Appoints Kevin Arias as Advisor to the Board of Directors, Strengthening Strategic Leadership • ELMGF • Sep 18, 2024 10:29 AM
Mawson Finland Limited Further Expands the Known Mineralized Zones at Rajapalot: Palokas step-out drills 7 metres @ 9.1 g/t gold & 706 ppm cobalt • MFL • Sep 17, 2024 9:02 AM
PickleJar Announces Integration With OptCulture to Deliver Holistic Fan Experiences at Venue Point of Sale • PKLE • Sep 17, 2024 8:00 AM

