Is S&P 500 setting up for a January break? By Almanac Trader
* January 11, 2017
Despite New Year bullishness from our early January indicators and our expectation for full-month January Barometer gains that will support our modestly bullish 2017 Forecast, a mid-January break in equities is looking increasingly likely. Since 1996 this January break has been more pronounced and more consistent. This trade, last featured in the Commodity Trader’s Almanac 2013, is beginning to set up nicely right now.
The stock market has demonstrated a tendency to retreat after the first of the New Year, especially when there has been a strong fourth quarter gain. Once the New Year begins we often see a profit taking correction. Investors tend to sell stocks to lock in profits in order to defer taxes from capital gains after the New Year begins. Even though the best time to be long the overall equity markets lasts from October through late April, this January break can certainly give short-term, nimble traders a nice return. With stocks struggling to move higher this week this trade is setting up a little later this year.
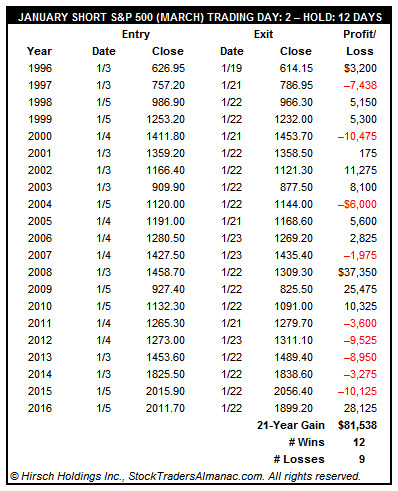
The table below of the “big” S&P 500 contract shows the typical January break. Since 1996 shorting the March contract on or about the second trading day of the New Year and holding for twelve trading days has produced gains 12 of the last 21 years for a success rate of 57.1% and a cumulative gain of $81,538 (based upon trading a single contract excluding fees and taxes).
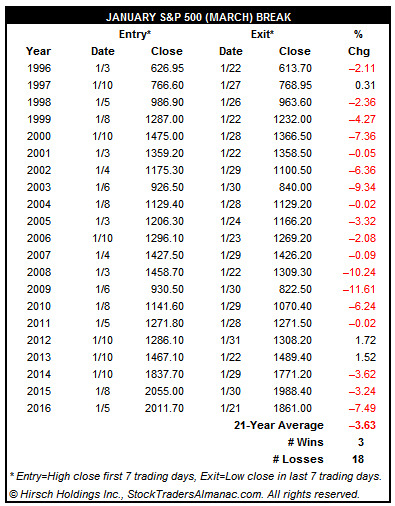
The results in the above table are based upon specific entry and exit dates with no further analysis being applied. This trade potentially could have been successful in 18 of the last 21 January’s with the application of technical indicators. The average decline from the high close in the first seven trading days in January to the low close in the last seven trading days in January has been 3.6% since 1996 using the same “big” S&P 500 contract.
Information posted to this board is not meant to suggest any specific action, but to point out the technical signs that can help our readers make their own specific decisions. Your Due Dilegence is a must! • DiscoverGold
Register for free to join our community of investors and share your ideas. You will also get access to streaming quotes, interactive charts, trades, portfolio, live options flow and more tools.


 News
News  Market Data
  Discover