


Wednesday, December 28, 2016 11:22:14 AM
Everything suggests continued weakness unless one feels today's volume was suggesting a bottom due to capitulation had occurred, which I do not. There's no one left to capitulate, IMO, and what we see is MMs, shorters and day traders, mostly, driving the action.
Today was a common, for us, open high, go higher, plummet, recover some, plummet again, and all with a few longish flattish periods thrown in.
We've had a re-appearance of, apparently, the west coasties. In these most recent cases they have come with relatively larger quantities on the bid at $0.75ish. With the offers generally being a much smaller quantity during most of the day, this seems to be an attempt to prevent a price drop but not a strong rise. I don't know why. If they were really bullish these price levels should cause them to hit the offers, which you can see is not the general behavior when examining buy percentages, both intra-day and EOD. Could be shorters just sitting there catching covering shares I guess.
I'll never know.
There were no pre-market trades.
09:30-10:04 began one of the typical patterns, open low, bounce high and drop, after it opened the day with a 7,494 sell for $0.76 & $0.76 x 250, $0.7550 x 450, and 300 $0.7597 (the only buy).
Then came 9:32's 100 $0.7650, 9:34's 1K $0.7650, 9:37's 100 $0.7614, 9:38's 200 $0.77/$0.7662, 9:39's 500 $0.77, 9:40's 10.8K $0.7700/60/00/$0.7690/80/60/$0.7558/$0.7745, 9:43's 12.4K $0.7558/50/11/58 (1.1K), 9:44's 600 $0.7558/11 (100), 9:46's 400 $0.7571, 9:49's300 $0.7594, 9:50's 1.9K $0.7580/$0.7638, 9:54's 400 $0.77, 9:55's 300 $0.7550, 9:56's 10.8K $0.7573/60 (9.6K)/$0.7550, 9:58's 500 $0.7559, 9:59's 400 $0.7551/$0.76/$0.7576, 10:01's 28.7K $0.7557/51/50/20/11/10/05/02/00, 10:02's 500 $0.7501, 10:03's 29.2K $0.7503/05 (25K blk)/05, and ended the period on 10:04's 200 $0.7506.
10:05-10:21 began a very low-volume climb up and fall back to near it's starting point after 10:05's 500 $0.7505/83. B/a at 10:09 was 1.2K:800 $0.7515/19, 10:17 200:900 $0.7526/43, 10:37 2K:1.2K $0.7501/82. The period ended on 10:21's 4.5K $0.7525/06/05/24/05.
10:22-12:00 began low/medium-volume mostly $0.7500/1 on 10:22's 100 $0.75. At 10:58 trade became very low/no-volume. B/a at 11:07 was 23.2K:1.1K $0.7500/1 (west coasties arrive?), 11:18 21.3K:1.2K $0.7500/1, 11:38 22.8K:200 $0.7500/1. 11:39-:42 someone tried bumping the range doing few-hundred share trades in the $0.7700/xx range, bypassing the presented b/a, even though the b/a remained at $0.7500/1. There was no volume to it at all. B/a at 11:48 was 20.7K:2.1K $0.7500/3. The period ended on 12:00's 400 $0.7501.
12:01-12:21 began with, again, someone trying to push the price with 12:02's $0.7501/05/$0.7662 (100). B/a at 12:03 was 500:100 $0.7511/22. This time the attempt succeeded as price began an extremely low/no-volume crawl up until 12:17-:22 popped it up on almost no volume to end at 12:21's 900 $0.7708/11.
12:22-13:43 began an extremely, almost no-volume, $0.7601/$0.77 on 12:22's 264 $0.7690/17. B/a at 12:52 was 400:100 $0.7650/89 (with MMs jiggling the bid quantities and 1/100ths of a penny price). After 13:00's 850 $0.7678/01/33 the range went very narrow $0.7690/$0.77, mostly - there were a couple low-volume one-minute small divergences - and generally continued narrowing as time passed. B/a at 13:04 was 3.3K:100 $0.7690/1, 13:17 400:1.3K $0.7691/$0.77, 13:32 100:600 $0.7680/91. The period ended on 13:43's 800 $0.7671.
13:44-13:59 did a relatively rapid "higher" volume step down on 13:44-:48's ~5.8K $0.7661/0/$0.7550/47. B/a at 13:48 was 1.7K:100 $0.7511/47. Then began a mostly low/medium-volume claw back up, hitting 13:49's 5K $0.7555 (4.2K)/54/55, and 13:50's 100 $0.76 before continuing the decline, hitting 13:58's 16.2K $0.7563/48/47/05/06/00. The period ended on 13:59's 2.7K $0.7538/00/02/03/02.
14:00-15:29, after seven no-trades minutes, began extremely low/no-volume $0.7503/4 on 14:07's 400 $0.7503/4. B/a at 14:22 was 400:900 $0.7503/4, 14:33 900:2.1K $0.7503/4, 14:47 1K:1.2K $0.7503/4, 15:02 900:700 $0.7503/4, 15:17 900:700 $0.7503/4. The period ended on 15:29's 7.1K $0.7503/4/3.
15:30-16:00 had b/a at 15:30 900:2.6K $0.7503/4, and then did 15:30's 24.5K $0.7503/4 (6.7K)/$0.77 (17.2K blk) to do a very low-volume drop from 15:30's $0.77 high. 15:33 hit $0.7504, 15:36 hit $0.7515, 15:36's b/a was 1K:1.9K $0.7503/$0.7693, 15:38 hit $0.767, 15:39 hit $0.7530/1, 15:40 hit $0.7531/43, 15:41 hit $0.7531/7, 15:44 hit $0.752, 15:46 hit $0.7529/31, similar behavior followed, 15:51's b/a was 200:2.1K $0.7521/9, 15:56 hit $0.7523/10, 15:58 hit $0.7510 and the period and day ended on 15:59's 200 2.9K $0.7506/3/12/13/22/23/22/20/03 and 16:00's 100 sell for $0.7503.
There were no AH trades.
Including the opening trades (closing didn't qualify), there were 17 larger trades (>=5K & 5 4K+) totaling 126,600, 28.96% of day's volume, with a $0.7570 VWAP. Excluding the opening trade, there were 16 larger trades totaling 119,106, 27.24% of day's volume, with a $0.7568 VWAP. For the day's volume the counts seem reasonable and the percentages are just a bit high I think. Looking at the breakdown below combined with the short percentage it looks like there were a lot of inter/intra-broker trades that bypassed the MMs. OTOH, price action the last couple days looks like there could have been some attractive covering prices for MM short sales, maybe leaving them short-term long and selling into today's market.
We'll never know.
Regardless, both sets of larger trades were above the day's aggregate $0.7548 VWAP so it looks like selling to either retail or shorters doing covering buys, as suggested by the most recent short interest reports 5.92% and 4.66% reductions, fitting with my thoughts that as these prices dropped the risk/reward change would lead to short covering by the shorters.
The general movement in buy percentage seems to match reasonably well with the VWAP movement - very little - after the usual early-session volatility as MMs put the opening range high to match their needs.Ending Period Period Period __Per. Trade_ Period_ % Day_ Per. End
Period Volume Low High _Dollar Val._ VWAP___ Volume Buy ~%
10:04 114037 $0.7500 $0.7760 $86,355.54 $0.7573 26.08% 14.53% Incl 09:30 $0.7600 7,494 4,250
09:40 $0.7700 4,843 09:43 $0.7558 5,500
09:56 $0.7760 8,768 10:01 $0.7500 5,100
10:03 $0.7505 25,000
10:21 25130 $0.7505 $0.7583 $18,935.14 $0.7535 5.75% 23.59%
12:00 140584 $0.7500 $0.7711 $105,507.15 $0.7505 32.16% 27.30% Incl 10:23 $0.7500 4,460 10:49 8,700
10:53 $0.7500 5,500 10:57 $0.7502 4,445
12:21 7222 $0.7501 $0.7711 $5,456.31 $0.7555 1.65% 28.45%
13:43 24892 $0.7601 $0.7711 $19,124.05 $0.7683 5.69% 30.63%
13:59 42943 $0.7500 $0.7661 $32,418.17 $0.7549 9.82% 31.77% Incl 13:56 $0.7559 5,000
13:58 $0.7500 5,640 $0.7547 4,700
15:29 35340 $0.7503 $0.7518 $26,517.30 $0.7503 8.08% 32.59% Incl 15:07 $0.7503 5,000
16:00 41915 $0.7503 $0.7700 $31,824.58 $0.7593 9.59% 37.54% Incl 15:30 $0.7504 5,000 $0.7700 17,200
On the traditional TA front, movements were:
After yesterday's brief interlude, we have returned to trend, and in a big way if you consider the volume, which suggests strength in the move lower. One could take the volume as a sign of capitulation, but I don't think so. We've seen, too many times in the recent past, similar volume changes that did not result in cessation of the move lower. Adding in the fact that yesterday's attempt to move up was on rising volume, suggesting strength in the move, was followed by today's action seems to reinforce this wasn't capitulation.__Open_ ___Low_ __High_ _Close_ Volume_
Today -0.65% 0.00% -0.51% -3.31% 187.47%
Prior 0.66% 1.35% -0.08% 1.09% 14.73%
It validates, I think, my statement yesterday, { Combined with the rising volume it's almost enough to cause a foolish enthusiasm to emerge in the "animal spirits". }
On my minimal chart we again had a lower high (marginally and the fifth consecutive day) while the low held steady. Support at $0.75 remains, apparently, strong, but I question how long it can hold on rising volume. If volume doesn't start to taper off it looks unlikely. We need to keep in mind this support price was previously untested.
OTOH, see the comment above about what happens when it looks like the west coasties arrive.
The fast EMA, which yesterday finally stopped its descent, resumed descending. The gap up to the slow EMA is still large.
In contrast to yesterday, today's close was more "honest", rather than being what I thought yesterday: { IMO the close was just the normal MM set up to attempt to suck more money out of the hapless market participants, if any are left, and/or other MMs. Their bots do battle you know. }
The experimental 13-period Bollinger limits yesterday were continuing to diverge ever faster as the lower limit was still quite near vertical while the upper limit was just starting to form a parabolic drop. I noted { That one will collapse quite rapidly if we stay in our current range. Look for a very low mid-point to arise before we see any relief appear I think. }. It has begun now.
On my one-year chart all the SMAs continue to decline.
Yesterday the oscillators I watch had improvement in RSI (barely above oversold), momentum (still below neutral), Williams %R (still oversold but up to -0.88xx), and full stochastic (still oversold at 8). MFI (untrusted by me) weakened and was in oversold at 0. ADX-related was flat.
Today weakening was seen in RSI (deeper in oversold), Williams %R (deeper in oversold at -99.86), and ADX-related. MFI (untrusted by me) remained at zero (2nd consecutive day). Marginal improvement occurred in momentum and full stochastic (still deep in oversold).
The experimental 13-period Bollinger limits, $0.6902 and $0.9829 ($0.7031 and $1.0007 yesterday), as mentioned, are now diverging.
All in, the intra-day breakdown items combined with the conventional TA leaves me thinking near-term bearish movement is most likely.
Percentages for daily short sales and buys moved in the same direction, normal and intrinsically good in normal circumstances, but not so in our current situation. That's because we are both in a nasty down trend that may break the potential $0.75 support, if the conventional TA analysis above is correct, and we know that market sentiment has been sour for a very long while now. AFAICT the only serious buyers are the shorters doing careful covering buys to lock in profits and reduce the risk portion of the current risk/reward scenario.
The spread narrowed again but is still a bit too wide to be suggesting a bottom when we are in a down trend.
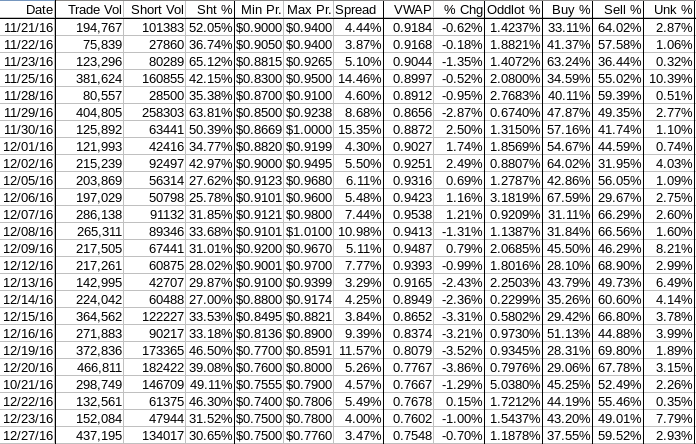
The VWAP's last twenty-four readings held steady for the sixth day at 16 negatives and 8 positives. Change since 11/21 is -$0.1635, -17.81%, and the averages of the rolling 24-day period seen in the last few days (latest first) are now -0.7967%, -0.7936%, -0.8037%, -0.7222%, -0.7346%, -0.6354%, -0.0814%, -0.0607%, 0.3441%, and 0.5853%.
All in, I expect near-term weakness to continue, predominately because of the short and buy percentage combined with the observed intra-day behavior.
Bill
Join the InvestorsHub Community
Register for free to join our community of investors and share your ideas. You will also get access to streaming quotes, interactive charts, trades, portfolio, live options flow and more tools.

