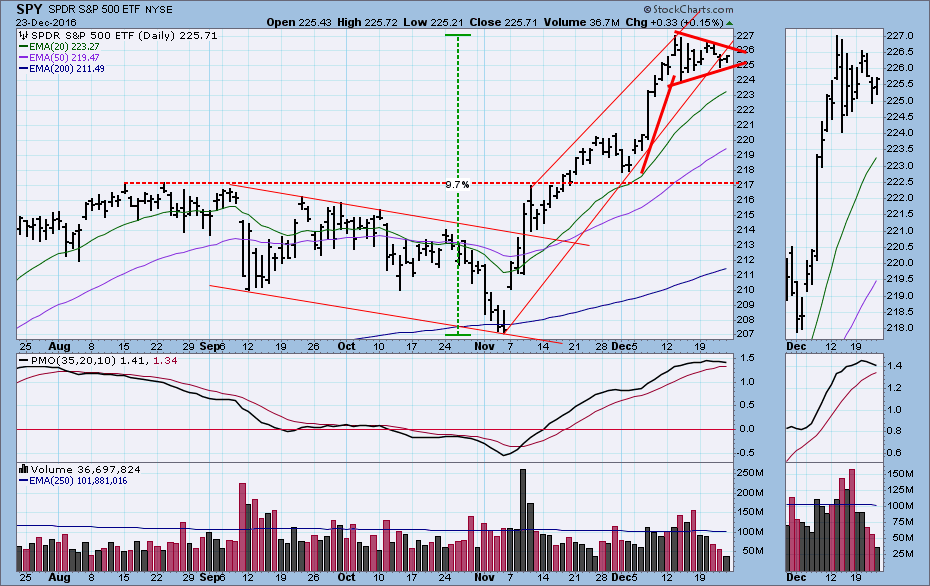
12/26 In the last few weeks the market has moved into a bullish pennant formation. In doing so it also violated the rising trend line on Thursday, but the trend line penetration has sideways, rather than sharply down, so I think the pennant carries more weight. Nevertheless, medium-term indicators are sufficiently overbought to cause me to start looking for a pause or a pullback.
On the following chart there are medium-term indicators for price (PMO), breadth (ITBM), and volume (ITVM). While not at extremes, they have all topped at the overbought side of their normal ranges. This is not a situation that can't be quickly reversed by more positive price action next week, but for now the market's potential for upside is degraded by these internals.
One thing we should remember is that we are in a bull market, and in that context overbought indicator tops are not normally prophets of doom. Yes, there will eventually be a final bull market top, but by my calculations the current cyclical bull market is less than a year old (February), and it should continue for at least another year or more.
CONCLUSION: This is probably not an ideal time to open new long positions. Our medium-term indicators have topped in overbought territory, so we should be expecting some kind of consolidation or correction; however, the recent pennant formation shows the short-term potential for another leg up before corrective action begins.
Register for free to join our community of investors and share your ideas. You will also get access to streaming quotes, interactive charts, trades, portfolio, live options flow and more tools.
 News
News  Market Data
  Discover