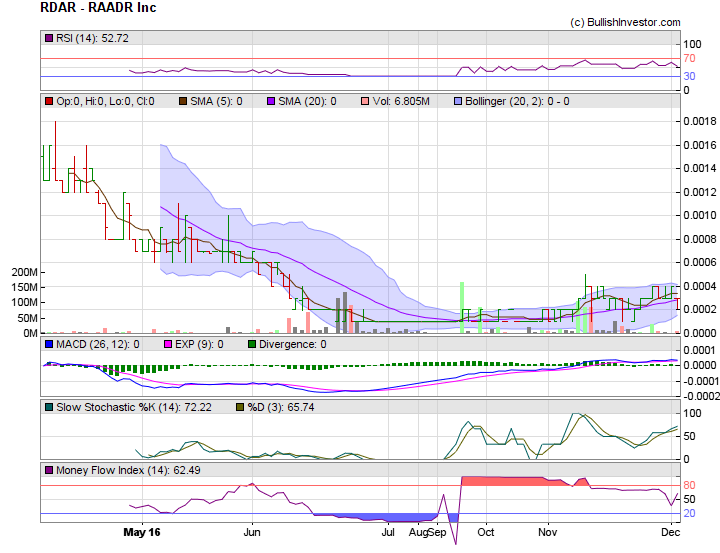
RDAR - Gaps at 0.0006 / 0.0007 / 0.0012 / 0.0013 All Gaps will get filled on this Run ! Gaps and Gap Analysis http://stockcharts.com/school/doku.php?id=chart_school:glossary_g http://stockcharts.com/school/doku.php?id=chart_school:chart_analysis:gaps_and_gap_analysis Gaps form when opening price movements create a blank spot on the chart. This occurs when the high of the day is below the low of the previous day or when the low of the day is above the high of the previous day. There is an old saying that the market abhors a vacuum and all gaps will be filled. Gaps are a significant technical development in price action and chart analysis, and should not be ignored. RDAR - Setting-Up for Break of 0.0005 Quarterly Report due This Week http://www.otcmarkets.com/stock/RDAR/profile News / Targets http://www.allotcbb.com/quote.php?symbol=rdar Time and Sales http://www.investorpoint.com/stock/RDAR-RAADR+Inc/market-makers-level2/ http://www.investorpoint.com/stock/RDAR-RAADR+Inc/price-history/ http://investorshub.advfn.com/uimage/uploads/2016/12/3/rxockRDAR_December_2_Technical_Chart_1.png http://www.stockscores.com/chart.asp?TickerSymbol=RDAR&TimeRange=180&Interval=d&Volume=1&ChartType=OHLC&Stockscores=1&ChartWidth=830&ChartHeight=500&LogScale=None&Band=None&avgType1=SMA&movAvg1=8&avgType2=SMA&movAvg2=34&Indicator1=RSI&Indicator2=PPO&Indicator3=AccDist&Indicator4=MFI&endDate=&CompareWith=&entryPrice=&stopLossPrice=
 News
News  Market Data
  Discover