


Wednesday, December 07, 2016 11:52:20 AM
By wave theory, Elliot/Gann etc., which is widely followed
Hmmm not sure that chart will show, but here is the page on Investopedia that explains it, look at the 5 wave chart. Here is another try:
NOTE: IT DID WORK, SO PREVIEW DID NOT SHOW CHART BUT IT WORKED. fIRST ONE WAS PUTTING IMAGE LINK IN BRACKETS CREATED BY THE "IMAGE" BUTTON, EASIER THAN UPLOADING TO IHUB (2ND WAY DID IT)
The bottom line is were are still OR are STILL in wave 1, which means it will go much further than what we have seen. The last 3 days could be considered Wave 2, again either way very bullish.
And this was not a 1-2 day wonder like has happened to BWMG before, look at a 1 year chart, it has never had a sustained wave 1 like we have seen last 3 weeks or so.
Cheers
here is the article: http://www.investopedia.com/articles/technical/111401.asp
Elliott Wave Theory By Investopedia Staff
Ralph Nelson Elliott developed the Elliott Wave Theory in the late 1920s by discovering that stock markets, thought to behave in a somewhat chaotic manner, in fact traded in repetitive cycles.
Elliott discovered that these market cycles resulted from investors' reactions to outside influences, or predominant psychology of the masses at the time. He found that the upward and downward swings of the mass psychology always showed up in the same repetitive patterns, which were then divided further into patterns he termed "waves".
Elliott's theory is somewhat based on the Dow theory in that stock prices move in waves. Because of the "fractal" nature of markets, however, Elliott was able to break down and analyze them in much greater detail. Fractals are mathematical structures, which on an ever-smaller scale infinitely repeat themselves. Elliott discovered stock-trading patterns were structured in the same way.
Market Predictions Based on Wave Patterns
Elliott made detailed stock market predictions based on unique characteristics he discovered in the wave patterns. An impulsive wave, which goes with the main trend, always shows five waves in its pattern. On a smaller scale, within each of the impulsive waves, five waves can again be found. In this smaller pattern, the same pattern repeats itself ad infinitum. These ever-smaller patterns are labeled as different wave degrees in the Elliott Wave Principle. Only much later were fractals recognized by scientists.
In the financial markets we know that "every action creates an equal and opposite reaction" as a price movement up or down must be followed by a contrary movement. Price action is divided into trends and corrections or sideways movements. Trends show the main direction of prices while corrections move against the trend. Elliott labeled these "impulsive" and "corrective" waves.
Theory Interpretation
The Elliott Wave Theory is interpreted as follows:
Every action is followed by a reaction.
Five waves move in the direction of the main trend followed by three corrective waves (a 5-3 move).
A 5-3 move completes a cycle.
This 5-3 move then becomes two subdivisions of the next higher 5-3 wave.
The underlying 5-3 pattern remains constant, though the time span of each may vary.
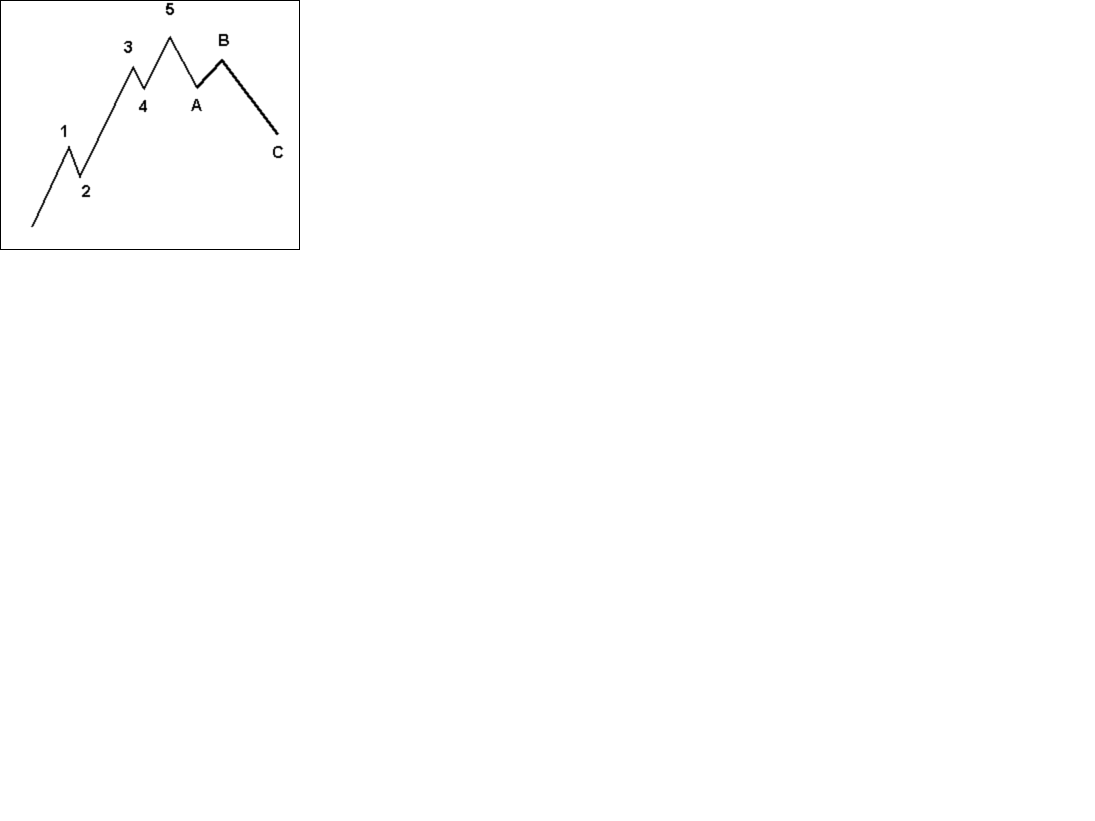
Let's have a look at the following chart made up of eight waves (five up and three down) labeled 1, 2, 3, 4, 5, A, B and C.
elliot1.gif
You can see that the three waves in the direction of the trend are impulses, so these waves also have five waves within them. The waves against the trend are corrections and are composed of three waves.
elliot2.gif
Theory Gained Popularity in the 1970s
In the 1970s, this wave principle gained popularity through the work of Frost and Prechter. They published a legendary book on the Elliott Wave entitled "The Elliott Wave Principle – The Key to Stock Market Profits". In this book, the authors predicted the bull market of the 1970s, and Robert Prechter called the crash of 1987. (For related reading, see Digging Deeper Into Bull And Bear Markets and The Greatest Market Crashes.)
elliot3.gif
The corrective wave formation normally has three distinct price movements - two in the direction of the main correction (A and C) and one against it (B). Waves 2 and 4 in the above picture are corrections. These waves have the following structure:
elliot4.gif
Note that waves A and C move in the direction of the shorter-term trend, and therefore are impulsive and composed of five waves, which are shown in the picture above.
An impulse-wave formation, followed by a corrective wave, form an Elliott wave degree consisting of trends and countertrends. Although the patterns pictured above are bullish, the same applies for bear markets where the main trend is down.
Read more: Elliott Wave Theory | Investopedia http://www.investopedia.com/articles/technical/111401.asp#ixzz4SAiLEIe8
Follow us: Investopedia on Facebook
Recent BWMG News
- Form 8-K - Current report • Edgar (US Regulatory) • 02/13/2024 08:27:11 PM
- Form 10-Q - Quarterly report [Sections 13 or 15(d)] • Edgar (US Regulatory) • 11/20/2023 07:07:39 PM
- Form NT 10-Q - Notification of inability to timely file Form 10-Q or 10-QSB • Edgar (US Regulatory) • 11/14/2023 04:55:11 PM
- Form 10-Q - Quarterly report [Sections 13 or 15(d)] • Edgar (US Regulatory) • 08/14/2023 08:01:27 PM
- Form 8-K - Current report • Edgar (US Regulatory) • 06/29/2023 04:34:38 PM
Bantec Reports an Over 50 Percent Increase in Sales and Profits in Q1 2024 from Q1 2023 • BANT • Apr 25, 2024 10:00 AM
Cannabix's Breath Logix Alcohol Device Delivers Positive Impact to Private Monitoring Agency in Montana, USA • BLO • Apr 25, 2024 8:52 AM
Kona Gold Beverages, Inc. Announces Name Change to NuVibe, Inc. and Initiation of Ticker Symbol Application Process • KGKG • Apr 25, 2024 8:30 AM
Axis Technologies Group and Carbonis Forge Ahead with New Digital Carbon Credit Technology • AXTG • Apr 24, 2024 3:00 AM
North Bay Resources Announces Successful Equipment Test at Bishop Gold Mill, Inyo County, California • NBRI • Apr 23, 2024 9:41 AM
Epazz, Inc.: CryObo, Inc. solar Bitcoin operations will issue tokens • EPAZ • Apr 23, 2024 9:20 AM

