I woke up early this morning and finished my analysis. What was the project?
* Use my Daily Phase chart to trade each of the 8 S&P sectors, either long or cash. * Maintain a 100% investment of capital to those sectors that have long signals.
Major issues I ran into as I worked on the analysis:
* For any one sector the number of trades is pretty small, but when rebalancing coming into play, I needed the ETF price for all sectors on any date that one sector traded. The only way to accomplish this was to create a dividend/stock split adjusted database for each sector. I wanted to use Yahoo data, but they still don't have their adjusted close working correctly, so I had to make up my own database.
* I quickly realized that if I only had 1 sector that had a long signal, investing 100% in that sector might not be a good idea. Also it would have caused way more rebalancing trades. So I decided that the first 4 sectors to generate a long signal would each get 25% allocation of cash.
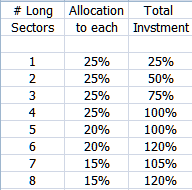
* When I used the above idea for the first 4 sectors, but then rebalanced so that I was always 100% equally invested above 4 sectors with long signals, the number of rebalance trades still got to be an issue. I also felt that if maybe there were at least 6 sectors that had long signals, this must be a very strong market, so why not invest a bit above 100%. So I developed and used the following table. It brought the number of trade and rebalance trades up to 82 ytd, from the original number of 35 for trading each sector separate. I felt 82 was a reasonable number as it represents about 2 trades per week on avg. With IB's $1/trade or $.005/share cost, the cost of commissions is not all that large. However for the analysis that I did, 82 trades would be about .8% of the initial capital for the account amount that I used.
* My original spreadsheet also rebalanced all long sectors anytime a new sector was added or dropped. To cut down on the number of trades, if the allocation to a certain sector did not change, then no trade was allowed. The number of shares to rebalance was always small.
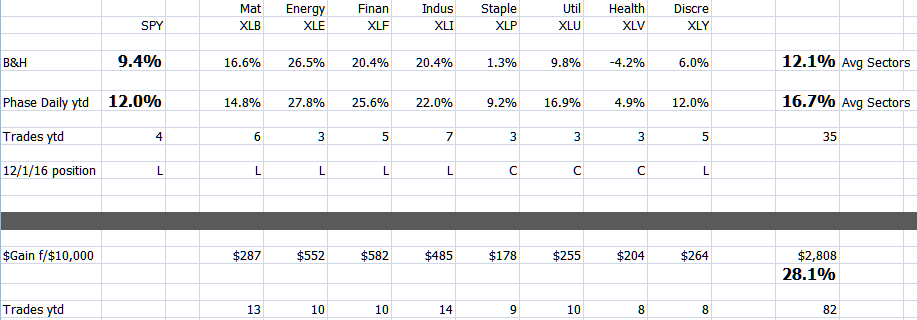
So after developing a pretty complex Excel spread sheet to make all the calculations for each sector and then adding up the results, the end result is that a $10,000 cash start returned $2,808 for a 28.1% yield. I knew it had to be higher, I just wasn't sure how much higher. But an almost doubling of yield was very welcome.
At the bottom of the table below, it shows that amount of gain that came from each fund to make up the $2808. As would be expected, the ETF's with the largest stand alone gains, contributed the most dollars to the what I developed.
I am pleased enough with this result that I am now making plans to use this method for one of my accounts or part of one. I have already developed a new allocation table that would allow investment to go as high as 125%, but the key is that as a new long signal is added, not all of the previous allocations have to be adjusted. My next step will to be to calculate the gain and number of trades using this method.
I also believe that actual trading real time that some obvious non trades might come up. For example, say I had gone long 25% initially on a sector and then later adjusted to 20% as other sectors were added long. Now later on again, one of the other sectors signaled to cash which would call for my original sector to go back to 25%. But looking at a chart, I can see that that sector is topping out and could expect a sell signal maybe soon. This would be a good time not to rebalance and increase the allocation to that sector.
Trade the Charts and not the Heart - Expect the trend to continue until it doesn't - Realtime is the real deal
Register for free to join our community of investors and share your ideas. You will also get access to streaming quotes, interactive charts, trades, portfolio, live options flow and more tools.
 News
News  Market Data
  Discover