SPY: Is the Trump Rally Pausing or Over? By Carl Swenlin
* December 4, 2016
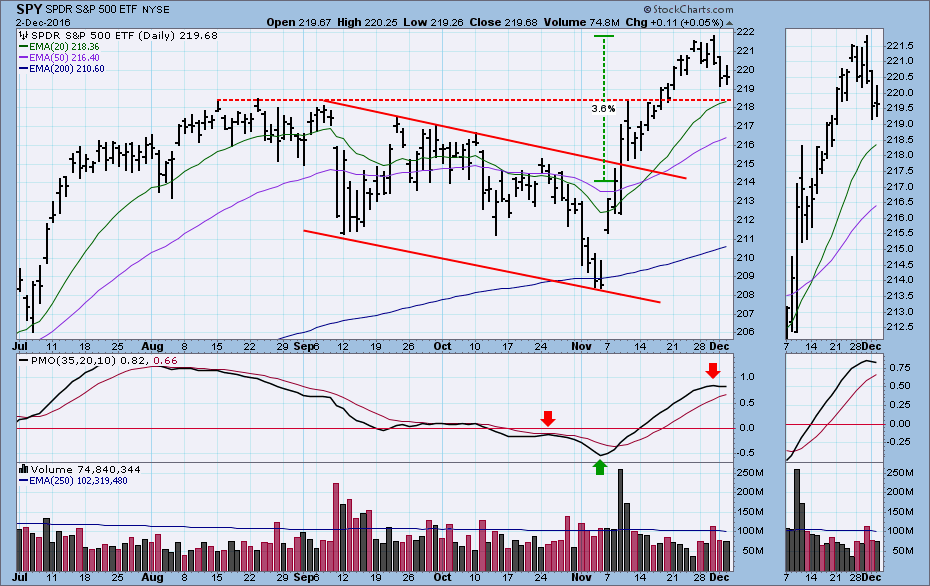
The market has rallied about +6.5% from the November low, but less than half of that can be attributed to the election results. As of the close on Tuesday, November 8, it was widely believed that Clinton would be the winner. When the opposite result emerged, the market rallied an additional +3.6%. By itself, this was not a spectacular advance, and a pullback began after Wednesday's intraday high. Is this a medium-term top, or merely a technical correction?
No one knows for sure, but we are in a bull market, so we should assume outcomes will be bullish until proven otherwise. About two weeks ago the market blew through a line of resistance drawn across the previous all-time highs in August. Last week a new, all-time high was made, then the market met technical expectations -- it pulled back toward the point of breakout. So far, so good, but there are some problems.
First, the PMO topped. It is a shallow top that can easily be reversed by positive price action this week, but for now it is a negative.
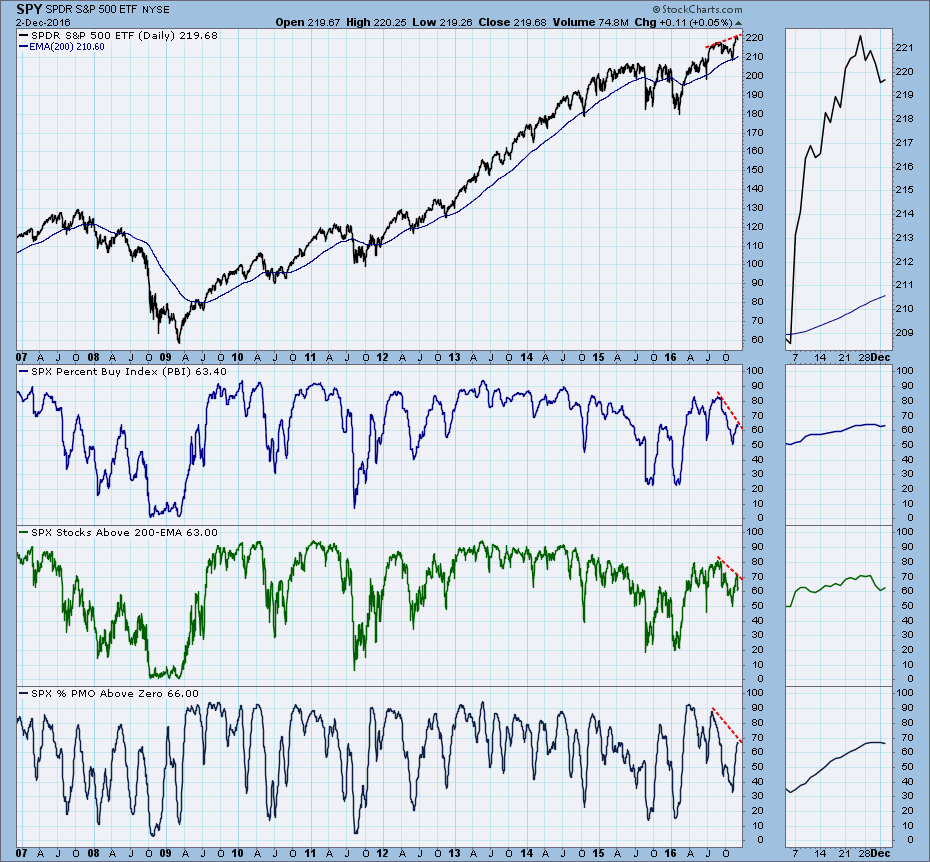
Second, longer-term indicators are showing rather sharp negative divergences, and their readings are substantially lower than we might expect with the market making new, all-time price highs. For example, the Percent Buy Index (PBI) shows that only 63% of S&P 500 stocks are on Price Momentum Model (PMM) BUY signals. The other two indicators show a similar lack of participation. The flip side is that there is still plenty of room for the indicators to move higher.
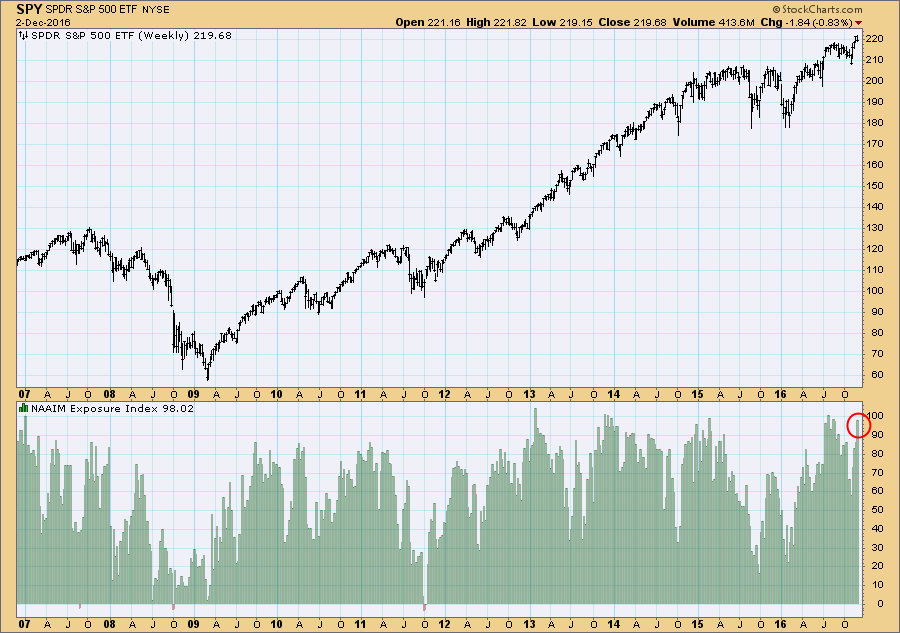
Finally, sentiment is getting a bit too bullish. The National Association of Active Investment Managers (NAAIM) Exposure Index below is near record bullish readings.
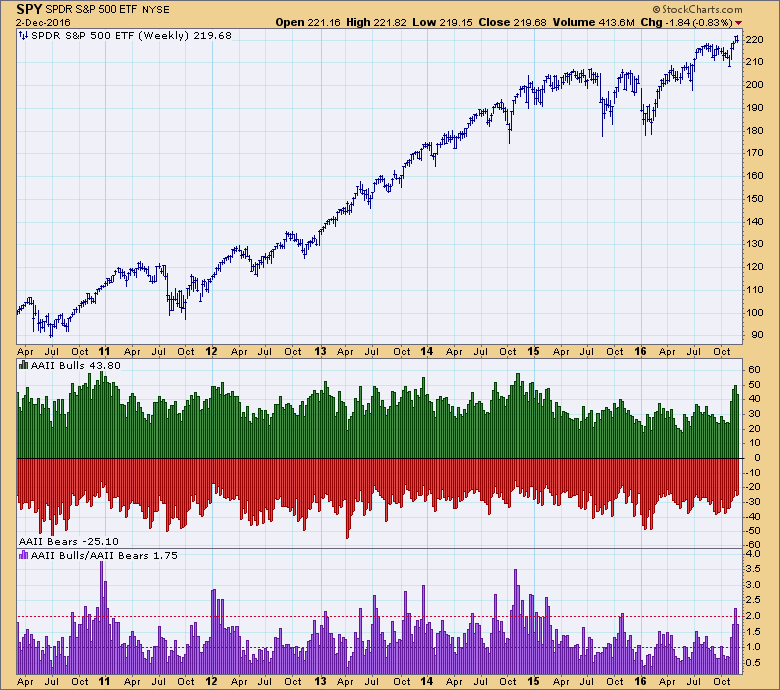
And AAII Investor Sentiment approached a two-year high two weeks ago.
CONCLUSION: I am concerned that there are suddenly too many bulls, but experience shows that extreme sentiment readings can appear well ahead of a price top. While some of the bullishness can be justified because of the prospect of a new business-friendly administration in the White House, some technical indicators are not confirming recent record price highs. Our immediate concern should be that SPY does not fall below the support line at 218.40. Should that support fail, bigger problems could emerge.
Technical Analysis is a windsock, not a crystal ball.
Click on "In reply to", for Authors past commentaries
Information posted to this board is not meant to suggest any specific action, but to point out the technical signs that can help our readers make their own specific decisions. Your Due Dilegence is a must! • DiscoverGold
Register for free to join our community of investors and share your ideas. You will also get access to streaming quotes, interactive charts, trades, portfolio, live options flow and more tools.


 News
News  Market Data
  Discover