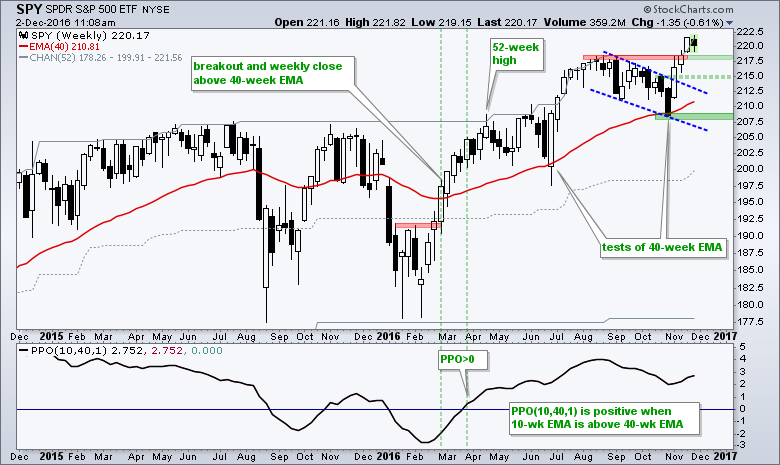
The S&P 500 is the most important benchmark for the stock market and the long-term trend is clearly up. This means we are in a bull market. This weekly candlestick chart shows the 40-week EMA in red, 52-week price channels in gray and the PPO(10,40,1) in the indicator window. SPY turned bullish in March with the breakout, close above the 40-week EMA and positive PPO (green dashed lines). The ETF also recorded a 52-week high with a move above the 52-week Price Channel in mid April. The upper line marks a 52-week high, the lower line marks a 52-week low and the middle line (dashed) is the average of the two. A move above the upper line denotes a 52-week high, while a move below the lower line marks a 52-week low.
We can debate overbought readings and the validity of the breakout, but I do not think we can debate the overall trend (up). I will remain long-term bullish on the broader market as long as 208 holds on a closing basis and the PPO remains positive. At this point, I am looking to identify levels where SPY could reverse after a pullback, which everyone seems to be waiting for. Broken resistance marks the first area around 218 and the channel breakout marks the second area around 215. Perhaps a reversal will materialize between 215 and 218 if we see a pullback.
Register for free to join our community of investors and share your ideas. You will also get access to streaming quotes, interactive charts, trades, portfolio, live options flow and more tools.
 News
News  Market Data
  Discover