


Friday, December 02, 2016 9:43:34 AM
The (un)conventional TA all suggest near-term improvement, but for the increasingly weakening volume. "Volume is the truth teller". I'll go with the volume and say I think near-term will cease VWAP improvement and, adding in my TFH friend, suggest we'll see higher volume, increasing short percentage and weakening price within consolidation. This latter scenario is briefly reasoned at the bottom of today's post.
There were no pre-market trades.
09:30-11:21 opened the day with a 1172 @ $0.8820 & $0.8820 x 100, $0.8971 x 1.4K and $0.90 x 250. B/a at 9:31 was 6.1K:25 $0.8821/$0.89 (offer backed by presented 351 $0.90). Then came 9:37's 100 $0.90, 9:40's 3K $0.90->$0.8980->$0.8821/2, 9:41's 200 $0.8822/$0.8991, 9:43's 2.7K $0.8980 (2.5K)->$0.8822, 9:48's b/a 1.6K:276 $0.8908/$0.90, 9:52's 100 $0.8920, 9:53's 2.7K $0.91 (~1.7K)/$0.9199, 9:54's 100 $0.8921, 9:58's 140 $0.8933, 9:59's b/a 1K:100 $0.8923/$0.90, 10:04's 1.3K $0.8988/24/25, 10:06's 200 $0.90, 10:07's 1.3K $0.9005/$0.9185 (1K), 10:11's 315 $0.9199/79, 10:12's 870 $0.9176->$0.9024 (750).
That began an extremely low/no-volume flattish $0.9010/$0.91, with rising lows. B/a at 10:14 was 300:1.1K $0.9007/$0.9150, 10:20 1.5K:1.5K $0.9009/$0.9100, 10:25 1.1K:1.1K $0.9023/$0.9100, 10:31 1.5K:100 $0.9035/99. By 10:37 range was $0.9036/99. B/a at 10:47 was 800:1.8K $0.9045/$0.9100. By 10:50 range was $0.9045/99. B/a at 11:09 was 900:2.1K $0.9055/$0.911s. At 11:09 range narrowed to $0.9045/53. B/a at 11:18 was $0.9039/90. The period ended on 11:21's 220 $0.9043.
11:22-12:39, after one no-trades minute, began extremely low/no-volume $0.9003/75 (mostly low $0.90xx), with lows rising to $0.905x at 12:03, on 11:23's 3.7K $0.9080/40/37/00/01. B/a at 11:33 was 700:100 $0.9004/5, 11:41 500:1.6K $0.9007/75, 12:02 1K:1.6K $0.9051/75, 12:16 200:2.4K $0.9065/71. Volume and range were interrupted by 12:26's 8.2K $0.9052/68/51/00/->$0.9001/2. Range continued at $0.9071/5. Volume switched to very low/medium at 12:28. B/a at 12:31 was 700:900 $0.9003/75. The period ended on 12:39's 101 $0.9003.
12:40-16:00 began extremely low/no-volume (interrupted occasionally by 3K/5K minutes) $$0.9000/75, with a slowly falling range, on 12:40's 8.3K $0.9002/00->$0.8903/00->$0.9075. B/a at 12:49 was 2.1K:200 $0.9000/75. At 12:51 range was $0.9001/25. B/a at 13:03 was 2.7K:400 $0.9000/50, 13:03 2.7K:400 $0.9000/50. At 13:12 range was $0.9000/25. B/a at 13:17 was 400:3.1K $0.9001/25, 13:32 100:1.9K $0.9001/25, 13:47 100:1.8K $0.9001/25, 14:02 100:1.8K $0.9002/25, 14:17 200:1.6K $0.9002/25, 14:32 100:1.3K $0.9002/25, 14:47 200:1.4K $0.9004/25. Volume was interrupted by 14:55's 11K $0.9000/5. B/a at 15:02 was 200:100 $0.9001/24, 15:17 400:100 $0.9002/28, 15:32 200:800 $0.9003/49, 15:47 100:1K $0.9003/49. The period and day ended, with a little higher average volume in the last six minutes, on 15:59's ~3.96K $0.9003/21/22/26/25/03 and 16:00's 1,213 buy for $0.90, up a penny from yesterday's close.
There were no AH trades.
Excluding the opening and closing trades (didn't qualify), there were 4 larger trades (>=5K) totaling 25,706, 21.07% of day's volume, with a $0.9036 VWAP. Even considering the volume, I think the count of larger trades should have been a bit higher. However, the percentage of day's trade volume is right in the normal range so I'll have to consider my assessment of the count being suspect. All looks normal in that case.
The VWAP is slightly above the day's $0.9027. This makes me thing it wasn't shorters or MMs doing covering buys, but likely retail traders or investors doing these "larger" trades.
The summation accurately reflects what was seen watching the intra-day behavior - flattish all day long with extremely low volume, although not as low as 11/28's 80K, while buy percentage remained elevated for the second day and unlike 11/28's ~40%. Volume and TFH suspicions aside, if buy percentages can extend the readings of 50%+, sustained appreciation would become possible. That trend is not established though ... At least not yet.
 Ending  Period  Period  Period __Per. Trade_ Period_ % Day_ Per. End
 Period  Volume     Low    High _Dollar Val._ VWAP___ Volume Buy ~%
  11:21   30809 $0.8820 $0.9199    $27,809.09 $0.9026 25.25% 45.56%
  12:39   26005 $0.9000 $0.9080    $23,542.44 $0.9053 21.32% 55.41% Incl 12:26 $0.9068 6,000
  16:00   62955 $0.8900 $0.9075    $56,758.99 $0.9016 51.61% 55.12% Incl 12:40 $0.9000 6,600 14:40 $0.9024 5,000
                                                                         14:55 $0.9050 8,106
On the traditional TA front, movements were:
Everything but the volume movement is positive. The volume suggests, again, no strength in the movements, supporting my TFH concerns. Two consecutive days lower volume may suggest we are getting ready to roll over regardless of the VWAP improvements.__Open_ ___Low_ __High_ _Close_ Volume_
Today 1.74% 1.74% 2.36% 1.12% -3.10%
Prior -3.68% 1.99% -1.24% 1.34% -68.90%
On my minimal chart trade range remains comfortably within the rising triangle's (lower right orange lines) adjusted boundaries and our trade range is pretty much centered between the rising support and horizontal resistance, so it's not giving any clues as to near-term likely movement.
The Bollinger limits stopped converging quite rapidly. Our day's low price pulled away from the lower limit and is no longer "pushing" on it. That offers hope the coming movement is higher, although that would go against our history, fundamentals, and the shorters movement I'm expecting to appear.
With the continued declining volume as VWAP elevates a bit I think shorters are licking their chops. That makes me suspect we'll quickly see an increase in trade volume, reducing VWAP and increasing short percentage.
On my one-year chart the 20-day SMA continued rising while the 10, 50 and 200-day SMAs continued declining. If we hold this range the 20-day will continue rising four (again) more days, the 10-day will fall six days, the 50 ~28 days and the 200 about 180ish days.
Yesterday the oscillators I watch had every one, but for ADX-related, with marginal improvement.
Today, continuing the flip-flopping consistent with consolidation, improvement occurred in RSI, accumulation/distribution, MFI (untrusted by me), Williams %R, full stochastic, and ADX-related. Weakening occurred in momentum. Every thing is below neutral though. If it weren't for the volume's continued weakening this many oscillators improving would suggest near-term upside. That volume suggests my TFH concerns are real and, I think, likely to see what it suggests - a break lower within short-term consolidation or even exiting it.
The experimental 13-period Bollinger limits, $0.8675 and $0.9566 ($0.8688 and $0.9568 yesterday), stopped converging with the lower limit dropping more quickly than the upper limit. This drags the mid-point down and suggests any coming move should most likely be lower.
All in, still conflicting signals, Bollingers and volume vs. oscillators, keep me from getting a strong conviction about any near-term move. Adding in the consolidation triangle that has a resistance that has exhibited good strength and the history, including that our visual pattern since ~11/15 has looked like price was rolling over, and I'd have to lean towards increased mild bearish bias within consolidation (for now).
Percentages for daily short sales and buys moved in the same direction, normal and good, and short percentage is right at the bottom of my desired range (needs re-check). Buy percentage made a second day above 50%, which if sustained would give us sustained price appreciation, but did weaken from yesterday's. It's significance is diminished though by the falling, and very low, trade volume.
Unlike yesterday, the spread widened slightly from yesterday's "official" 3.67% as the day's high moved up more than the low. It's still within a range that could suggest continued consolidation is most likely, but it's borderline. Being within a consolidation pattern I think it's still suggesting no big move.
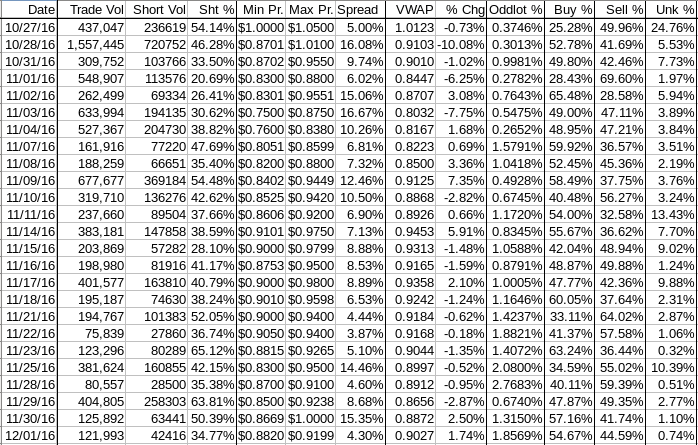
The VWAP's last twenty-four readings, for the second consecutive day, improved to 14 negatives and 10 positives from 15 and 9 respectively. Change since 10/27 is -$0.1096, -10.83%, and the averages of the rolling 24-day period seen in the last few days (latest first) are now -0.4019, %-0.5046%, -0.7608%, -0.7208%, -0.6795%, -0.7820%, -0.5530%, -0.9605%, -1.4049%, and -1.3868%.
Note we also have three consecutive days of the rolling average change improving. I suspect a trend may have begun.
All in, ignoring volume and TFH thoughts, these readings suggest near-term improvement is most likely. Factoring in volume that scenario is less believable though. Adding TFH thoughts to the volume consideration and I get a strong feeling that near-term we'll see VWAP weaken and shorters come in heavy on increased volume. Why? If they don't the folks pushing up on price will succeed and knowing the short interest has increased greatly the shorters will be at risk of a pretty big loss.
When volume is this low as price rises it is a perfect set-up because price is so easily moved and shorting very easily, and quickly, moves it downward.
Bill
Join the InvestorsHub Community
Register for free to join our community of investors and share your ideas. You will also get access to streaming quotes, interactive charts, trades, portfolio, live options flow and more tools.

