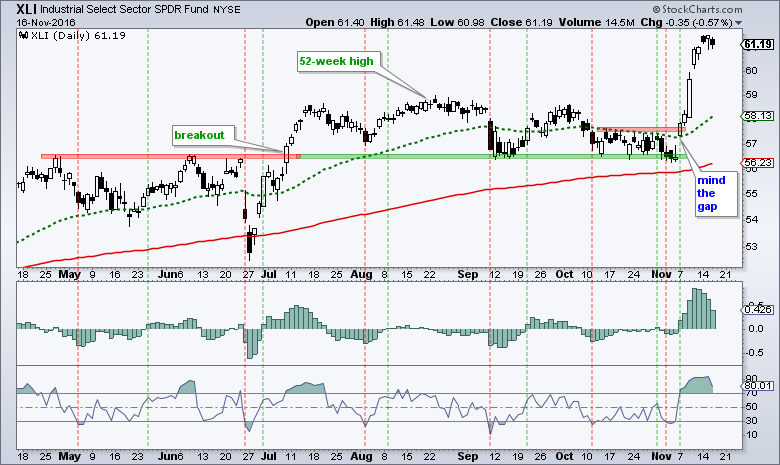
The Industrials SPDR (XLI) is another sector that surged and became short-term overbought. Instead of the PPO, I am showing this chart with the MACD Histogram (5,30,5) and RSI(5). The overall trend is up because the 50-day EMA has been above the 200-day EMA since late March and XLI started hitting 52-week highs in April. This bigger uptrend meant that the decline from mid August to early November was a correction within an uptrend. Defining the bigger trend is very important because it sets my trading bias (bullish).
The MACD Histogram (5,30,5) measures the difference between MACD (5,30,5) and its signal line. Thus, the histogram turns positive when MACD moves above its signal line and negative when MACD moves below its signal line. This makes it easy to spot signal line crossovers. The red lines show when RSI(5) becomes oversold and the green lines mark a subsequent move into positive territory for the MACD Histogram. The signals are not perfect, but it is a strategy chartists can use to filter their trading universe. Note that the PPO and MACD are basically the same indicators. MACD measures the absolute difference between two EMAs and PPO measures the percentage difference between two EMAs.
Register for free to join our community of investors and share your ideas. You will also get access to streaming quotes, interactive charts, trades, portfolio, live options flow and more tools.
 News
News  Market Data
  Discover