


Sunday, November 13, 2016 5:38:27 PM
Although the conventional TA is showing some signs of improvement, especially in the oscillators going from all weakening to mixed, all the signs right now are really those of consolidation with a weakening bias, at best, and just plain old reversal to start a leg lower seeming to be just on the horizon. My unconventional stuff supports this.
The intra-day behavior was open high, drop big, recover about half and stay there most of the day. Buy percentage was weak all day (see below) and the spread narrowed, suggesting consolidation at best, on falling volume, another sign of consolidation or a reversal near.
There was one pre-market unknown of 2K for $0.935.
09:30-09:37 opened the day with a 1,285 9,350 buy for $0.9350 and 1,239 more $0.9350/$0.9420. Then came 9:32's 1.5K $0.9301, 9:33's 11.4K $0.9300/1, 9:35's 9.5K $0.9300/1->$0.9203->$0.92->$0.9285->$0.92, 9:36's 13.6K $0.92571 (yes, 1/1,000 of a penny - not all that unusual!)->$0.9201/3->$0.9200/14->$0.92, and the period ended on 9:37's 9:37's 8,497 $0.92->$0.8639.
09:38-10:51, after one no-trades minute, recovered to the middle of the drop and did a low/medium-volume drop again on 9:39's ~1.1K $0.91->$0.8928->$0.91, 9:40's 600 $0.9070/3->$0.8831, 9:42's 700 $0.9099/$0.91, 9:44's 1.6K $0.883->$0.8801->$0.8999->$0.90, 9:45's 1.5K $0.90->$0.8801, 9:46's 100 $0.90, 9:47's 11K $0.8801->$0.88->$0.8801->$0.8803, and 9:48's 11.2K $0.8821/2/4->$0.88. Then began very low/no-volume $0.88xx/$0.90. B/a at 9:53 was 200:800 $0.8820/$0.8999. The period ended on 10:51's 15.2K $0.8822->$0.89->$0.8800/1->$0.8899->$0.88->$0.885->$0.884->$0.88->$0.8825->$0.88.
10:52-11:33 began a low/no-volume $0.8526/$0.879 on a drop by 10:52's 4.2K $0.8824->$0.88->$0.879->$0.8764->$0.8650/36->$0.8525->$0.8849. 11:02 began mostly very low/no-volume $0.8602/$0.879 and the period ended on 11:33's 100 $0.879.
11:34-13:36 began very low/no-volume $0.8601/$0.87 on 11:34's 200 $0.8651. Volume and range was interrupted by 11:53's 5.9K $0.859/$0.87. At 12:33 the highs began slowly dropping and got down to $0.8676 on 12:58's 4.5K $0.8604/76. The period ended on 13:36's 200 $0.8675/6.
13:37-13:53 began low/no/medium-volume $0.8568/86 (mostly low-$0.85xx) on 13:37's 8.2K $0.8645/8/4->$0.86->$0.8580/4->$0.8599/68->$0.86. The period ended on 13:53's 100 $0.858.
13:54-14:46, after one no-trades minute, began a relatively rapid very low/no-volume ascent from 13:55's 1.1K $0.8588->$0.87, hitting 14:06's 4.2K $0.8849 (100)->$0.8701 (4K)->$$0.8849 and 14:32's 2.7K $0.88->$0.8783->$0.88->$0.8801->$0.885->$0.90. Then came almost no-volume $0.8954->$0.899x/$0.90 and the period ended on 14:46's 300 $0.8994/3.
14:47-14:53, after one no-trades minute, did a short, wide-range few minutes on 14:48's 18.4K $0.8992 (~18K)->$0.8913, 14:49's 800 $0.8992->$0.87 and ended the period on 14:50-:53's ~7.1K $0.8743->$0.8846->$0.8991->$0.8714->$0.8982 (4.5K)->$0.8700/3.
14:54-15:53 began an extremely low/no-volume $0.8841/$0.8991 on 14:54's 100 $0.8991. Volume was interrupted by 15:03's 8.5K $0.8441/$0.8990. The period ended on 15:53's 200 $0.8947.
15:54-16:00 began the EOD volatility, with low, medium and high-volume minutes, swing between $0.871/$0.8947 on 15:54's 200 and $0.8786/$0.8948 and ended the period and day on 15:59's 4.5K $0.88->$0.8796/$0.8948->$0.8795/6->$0.879->$0.8786 and 16:00's buy of 500 for $0.8992.
There was one AH sell of 8,030 for $0.8873.
In/Excluding the opening and closing trades (didn't qualify), there were 14 larger trades (>=5K & 4 4K+) totaling 95,141, 29.76% of day's volume, with a $0.8932 VWAP. The count and percentage of day's volume seem in the normal range although the percentage is to the high side thanks to a few "larger larger trades" I would guess. The VWAP is above the days $0.8868 and my guess is that those periods with the higher VWAPs on higher buy percentages but little volume of "larger trades" suggest day/momo traders (early morning high VWAP with rising buy percentage) account for this. Don't forget - these folks can short too! This conclusion is colored by the belief that most normal retail longs are not in the market currently.
Adding in the very typical open high and quick drop followed by a partial retrace also seems to support this scenario. That was followed by the quite common very slow up, flat, up flat, ... re-trace higher, also suggesting the scenario.
On the traditional TA front, movements were:Ending Period Period Period __Per. Trade_ Period_ % Day_ Per. End
Period Volume Low High _Dollar Val._ VWAP___ Volume Buy ~%
08:07 2000 $0.9350 $0.9350 $1,870.00 $0.9350 0.63% 0.00%
09:37 47989 $0.8639 $0.9420 $44,397.10 $0.9252 15.01% 22.56% Incl 09:33 $0.9301 9,700 09:35 4,300
09:36 $0.9201 4,899 $0.9200 5,619
10:51 88346 $0.8800 $0.9100 $78,245.30 $0.8857 27.63% 19.56% Incl 09:47 $0.8800 5,800 10:23 $0.8854 10,000
10:50 $0.8850 4,223
11:33 24413 $0.8525 $0.8849 $21,205.34 $0.8686 7.64% 20.56% Incl 11:05 $0.8650 5,000
13:36 51225 $0.8590 $0.8700 $44,368.40 $0.8661 16.02% 33.94% Incl 11:37 $0.8651 5,000 12:25 $0.8698 7,000
12:51 $0.8684 5,000
13:53 17632 $0.8568 $0.8648 $15,144.39 $0.8589 5.51% 34.96%
14:46 17627 $0.8587 $0.9000 $15,437.49 $0.8758 5.51% 36.15% Incl 14:06 $0.8701 4,000
14:53 26220 $0.8700 $0.8992 $23,480.49 $0.8955 8.20% 40.94% Incl 14:48 $0.8992 16,570
15:53 25875 $0.8841 $0.8991 $23,078.82 $0.8919 8.09% 41.09%
16:00 8211 $0.8710 $0.8992 $7,254.61 $0.8835 2.57% 40.58%
16:05 8030 $0.8873 $0.8873 $7,125.02 $0.8873 2.51% 39.56% Incl 16:05 $0.8873 8,030
This looks like we're going to do a 100% retrace to the reporting day's 11/9 high of $0.9449 but with the volume declining will peter out when we hit it and likely reverse. However, see the comments below on the minimal chart.__Open_ ___Low_ __High_ _Close_ Volume_
Today 8.72% 1.46% -0.31% -3.83% -52.82%
Prior 4.88% 2.46% 7.38% 7.15% 259.97%

On my minimal chart, yesterday I said { Well, today we continued higher and on rising volume. But the volume got high enough that I suspect we may have topped - making a not atypical overshoot? If that's the case the upward move should stall out and volume should begin to decline. This doesn't say that I'm right yet, but does say it's time to keep an eye open for the start of a re-trace lower. This is likely an indecision point. }
Partly right and wrong, although not far off I think from seeing the end point. Our volume and high were lower, so we may have indeed topped out. We also had a higher low, giving a shrinking spread typical of very short-term consolidation as the support/resistance points are approached.
I've added a couple very short trend lines that yield a rising trend line and forms a rising right triangle with the 11/9 high. In a longer/stronger up-trend this would likely lead to a break above the horizontal leg of the triangle and we are in the area of the triangle where that becomes likely. I'm thinking that being in a strong down leg the break most likely will be lower when we encounter that resistance at $0.9449ish. That leads into some more of yesterday's thoughts.
{One possible outcome from such a move might be the eventual formation of a bullish (reverse) head and shoulders pattern, which would suggest a good upside move if the pattern completes. To make this pattern requires a re-trace down of about two days duration to a level similar to that of the left shoulder and then a rise to and through the neckline, which is level right now.
Another, and more likely I think, outcome is that we have started a down leg within a newly-developing consolidation pattern, which is what I've been expecting. Right now the potential H&S neckline would be the early possible resistance of this consolidation channel. The top of the left shoulder and head (i.e. the low-point) are initially the two potential support points. }
I may have been just a day or two early - I still think the most likely move will be lower and with the narrowing spread and reducing volume could even occur without touching the resistance.
That latter point seems unlikely though as there has been an obvious and somewhat reliable pattern of pushing the price up in the early trading, which is where the high is most frequently established, and then weakening. Sometimes a long slow move higher follows, sometimes a late-day surge higher, and sometimes it recovers little and just goes lower though.
So it's really hard to pick a more likely case at this juncture with any level of confidence at all.
The experimental 13-period Bollinger limits continued converging. But the upper and lower limits visually seem to be converging on the mid-point at a very similar rate now, giving us a stable mid-point for now.
On my one-year chart the four SMAs continue to decline and all will continue as a big enough rise has not been seen, which I consider highly unlikely for now.
The oscillators I watch yesterday had a nice move up on strongly rising volume. The oscillators all improved and were out of oversold territory. All but Williams %R were still below neutral.
Today some of them gave up the rise. Weakening was seen in RSI (further below neutral), Williams %R (below neutral) and ADX-related. Improvement continued in MFI (barely above oversold and untrusted by me), momentum (slightly above neutral now), full stochastic (%K just below overbought), and accumulation/distribution (still below neutral). Going mixed from yesterday's all improving fits with what I've been suggesting.
The experimental 13-period Bollinger limits, $0.7298 and $1.0659 ($0.7176 and $1.1059 yesterday) are converging on the middle at roughly the same rate now, so the mid-point is fairly steady ATM.
All in, the falling high and volume with rising low and oscillators going mixed, combined with the rising triangle suggesting resistance just above our current high, leads me to stick with my recent (but too early by a couple days?) thought that we've topped (that's not been shown to be too early ... yet) and will start another leg lower. However, note my comments above about the typical intra-day behavior - there's apparently someone with the ability that wants to walk the price higher and is doing so now regardless of fundamentals or general market sentiment. MMs? Shorters? Warrant holders? Who knows, but this last batch of warrant purchasers must be feeling somewhat cheated right now.
I suspect a battle is being waged between them and the shorters, suggested by the recent short interest report of a 27.78% increase following the prior (newest to oldest) +4.89%, +10.78 and +17.91 coming after a prior -9.06% reduction ending a trend of 4 out of 5 seeing reductions.
Dilution causes things like that, along with prices where they are at now.
Percentages for daily short sales and buys moved in the same direction but ended with values that conflict. Short percentage is about the middle of my desired range (needs re-check) but the buy percentage is below a reading that suggests anything but near-term lower. After three days in the range that indicated near-term strength, this is not a good sign, especially with the short percentage where is "belongs". Worse, the buy percentage was weak all day never even touching 30%+ until 13:00 and ~41% at 14:53.
The spread narrowed but is still too wide since we are in a longer-term down trend and, worse, was produced by the old open high and drop big routine early in the day and never recovered more than half the drop. This strongly suggests that we have indeed run out of steam when combined with the falling volume.
Of course, that falling volume also suggests that the weakness seen today is not yet exhibiting strength to the downside.
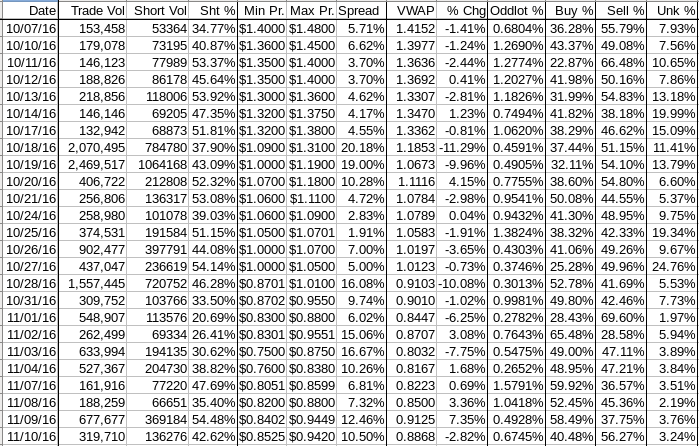
The VWAP's last twenty-four readings maintained for the second consecutive day the 15 negatives and 9 positives re-established three days ago. Change since 10/07 is -$0.5285, -37.34%, and the averages of the rolling 24-day period seen in the last few days (latest first) are now -1.8222%, -1.7635%, -1.8877%, -1.8884%, 1.9605%, -2.1754%, -1.7898%, -1.8093%, -1.5915%, and -1.5472%.
We can't seem to get a positive trend established in the VWAPs.
All in, it looks like more near-term weakness in store - maybe in the nature of consolidation if we are lucky.
Bill
Join the InvestorsHub Community
Register for free to join our community of investors and share your ideas. You will also get access to streaming quotes, interactive charts, trades, portfolio, live options flow and more tools.

