


| Followers | 680 |
| Posts | 141092 |
| Boards Moderated | 36 |
| Alias Born | 03/10/2004 |
Wednesday, October 26, 2016 8:28:10 AM
By Erin Heim
* October 25, 2016
Interestingly, Gold has put in a short-term bottom and has held onto it even through the Dollar's magnificent rally. This shows there is likely short-term internal strength and this current support could hold. There are still plenty of obstacles for Gold in the longer term as you'll see, but the new Price Momentum Oscillator (PMO) BUY signal is encouraging for the shorter term.
The longer term affects the intermediate term which in turn affects the short term so I'm going to start with the longer-term picture (monthly), followed by the intermediate-term picture (weekly) and the shorter-term daily chart.
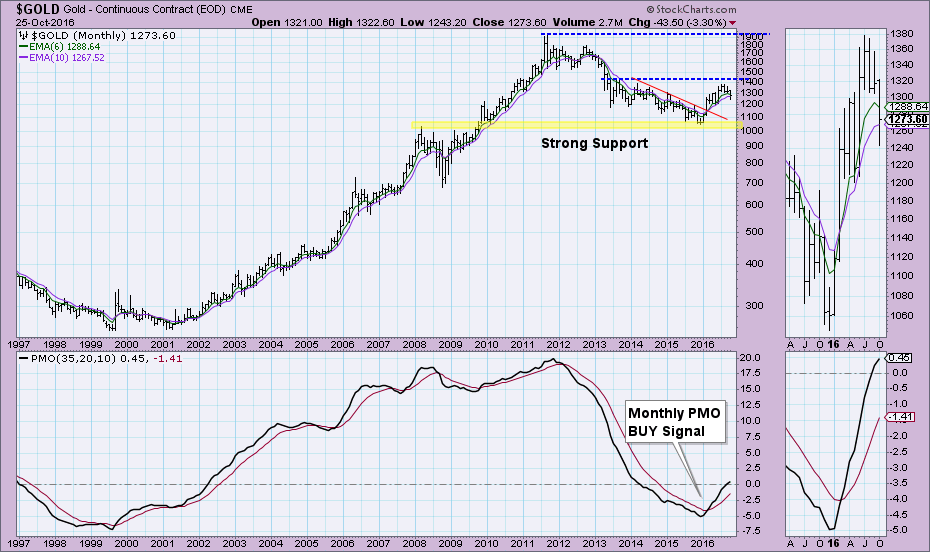
There are two positive attributes to the monthly chart worth noting. First and foremost is the monthly PMO BUY signal and continued positive momentum. Price broke out from a declining tops trendline (red) after testing strong support near the 1000 level. Unfortunately, the decline after failing to break above resistance is bearish. That breakdown hasn't posed a problem to the monthly PMO which is in positive territory, and price closed above the 10-month EMA.
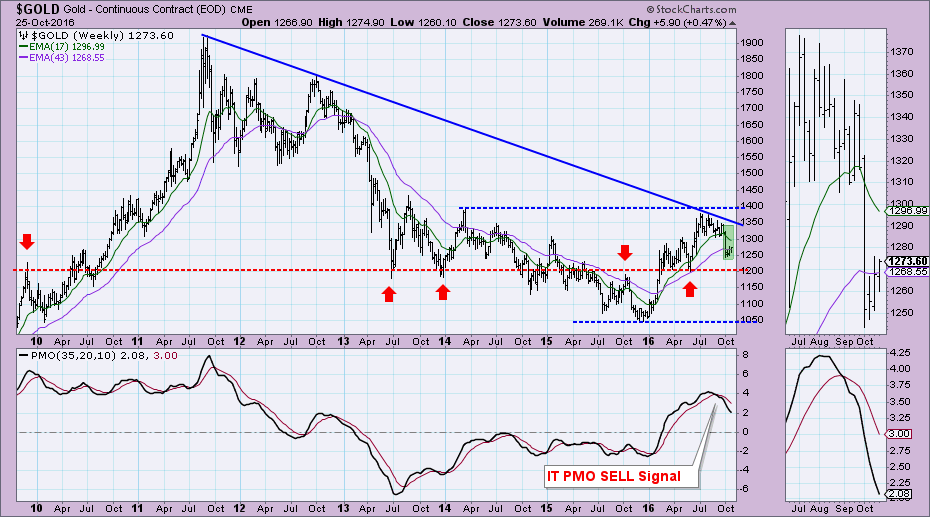
The weekly chart has the most problems. Where do I start? The weekly PMO is on a SELL signal and accelerating lower. Two areas of overhead resistance held, the declining tops trendline and horizontal resistance at around 2014 high. Support is strong at the 1200 level given the horizontal has been tapped a few times...the more 'touches' the stronger the trendline or support line. Next problem is the possible reverse flag formation I've highlighted in green.
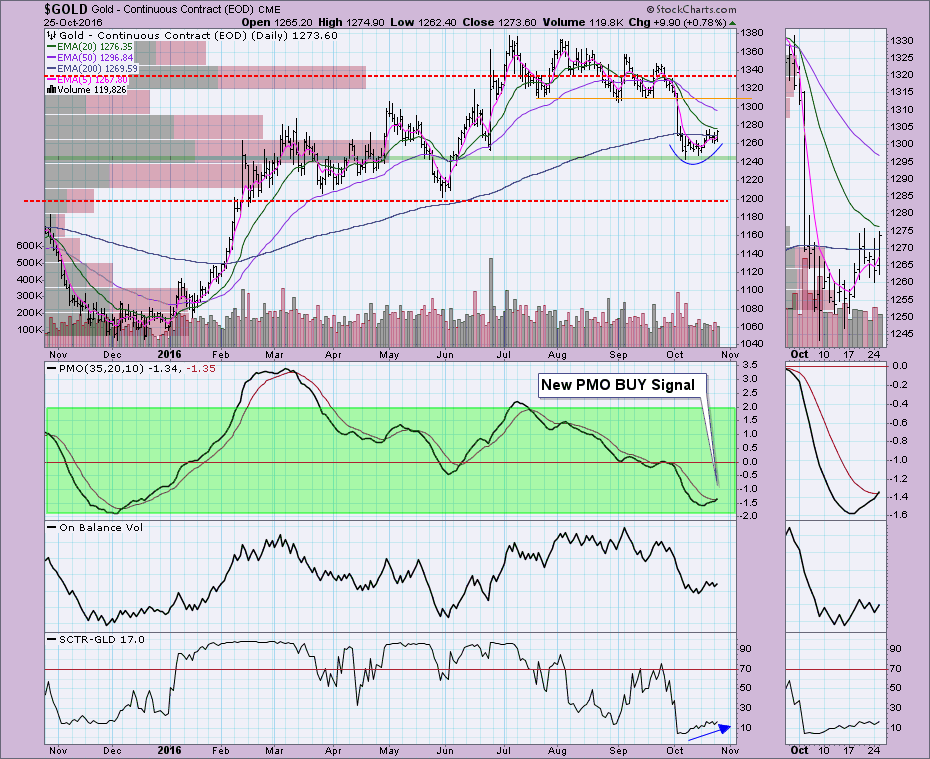
You might ask, "If the picture is so bleak, why did you title your article with a bullish headline?". The daily chart is the reason. I love seeing PMO crossover BUY signals at the bottom of the PMO range. Notice what happened after the one in late 2015 (although "past performance is no guarantee of future results" these signals are generally followed by a rally). The reverse flag noted on the weekly chart isn't as viable on the daily chart because of the rounded shape and noticeable rally off the lows. While this bottom doesn't line up with typical horizontal support, based on the volume by price bars, it is an area of price congestion that can certainly hold as support.
Conclusion: The short-term picture for Gold is bullish and suggests we will see a rally to return price back above 1300. The long-term monthly PMO and the short-term daily PMO are both on BUY signals and rising. The intermediate-term weekly PMO is dropping on a SELL signal. I suspect there will be continuation on this rally, but with the intermediate-term weekly chart looking negative, it won't likely pass overhead resistance at the 1380 level.
Technical Analysis is a windsock, not a crystal ball.
Happy Charting!
- Erin
http://stockcharts.com/articles/decisionpoint/2016/10/gold-recovering---new-oversold-pmo-buy-signal-encouraging.html
• DiscoverGold
Click on "In reply to", for Authors past commentaries
Information posted to this board is not meant to suggest any specific action, but to point out the technical signs that can help our readers make their own specific decisions. Your Due Dilegence is a must!
• DiscoverGold
Recent GOLD News
- Barrick Announces Extensive Exploration Partnership with Geophysx Jamaica • GlobeNewswire Inc. • 05/01/2024 10:15:00 AM
- Barrick to Ramp Up Production As It Remains On Track to Achieve 2024 Targets • GlobeNewswire Inc. • 05/01/2024 10:00:00 AM
- Barrick Declares Q1 Dividend • GlobeNewswire Inc. • 05/01/2024 09:59:00 AM
- Barrick Announces Election of Directors • GlobeNewswire Inc. • 04/30/2024 08:15:55 PM
- Barrick On Track to Achieve 2024 Targets • GlobeNewswire Inc. • 04/16/2024 11:00:00 AM
- Notice of Release of Barrick’s First Quarter 2024 Results • GlobeNewswire Inc. • 04/09/2024 11:00:00 AM
- Strategy-Driven Barrick Builds on Value Foundation • GlobeNewswire Inc. • 03/28/2024 09:20:38 PM
- Barrick Hunts New Gold and Copper Prospects in DRC From Kibali Base • GlobeNewswire Inc. • 03/20/2024 02:00:00 PM
- Barrick Opens Academy at Closed Buzwagi Mine • GlobeNewswire Inc. • 03/18/2024 08:00:00 AM
- Barrick to Grow Production and Value on Global Asset Foundation • GlobeNewswire Inc. • 03/15/2024 11:53:01 AM
- Loulo-Gounkoto Delivers Another Value-Creating Performance • GlobeNewswire Inc. • 03/10/2024 10:00:00 AM
- Passing of the Right Honorable Brian Mulroney • GlobeNewswire Inc. • 03/02/2024 01:17:35 AM
- Kibali and DRC Partner to Promote Local Content • GlobeNewswire Inc. • 03/01/2024 02:22:43 PM
- Tanzanian Parliamentary Committee Lauds Barrick’s Work at North Mara • GlobeNewswire Inc. • 02/23/2024 12:00:00 PM
- Form 6-K - Report of foreign issuer [Rules 13a-16 and 15d-16] • Edgar (US Regulatory) • 02/14/2024 10:28:08 PM
- Form 6-K - Report of foreign issuer [Rules 13a-16 and 15d-16] • Edgar (US Regulatory) • 02/14/2024 08:05:25 PM
- Clear Strategies and Strong Partnerships Set Barrick Up to Outperform, Says Bristow • GlobeNewswire Inc. • 02/14/2024 11:00:00 AM
- Barrick Announces New Share Buyback Program • GlobeNewswire Inc. • 02/14/2024 10:59:00 AM
- Barrick Declares Q4 Dividend • GlobeNewswire Inc. • 02/14/2024 10:58:00 AM
- NGM Strongly Positioned for Growth • GlobeNewswire Inc. • 02/10/2024 01:00:16 AM
- Form SC 13G - Statement of acquisition of beneficial ownership by individuals • Edgar (US Regulatory) • 02/08/2024 03:03:08 PM
- Form 6-K - Report of foreign issuer [Rules 13a-16 and 15d-16] • Edgar (US Regulatory) • 02/08/2024 12:46:55 PM
- Geologically Driven Asset Management Delivers Barrick’s Third Successive Year of Reserve Growth at Sustained Quality, While Unlocking Embedded Growth Portfolio • GlobeNewswire Inc. • 02/08/2024 12:00:00 PM
- Form SC 13G/A - Statement of acquisition of beneficial ownership by individuals: [Amend] • Edgar (US Regulatory) • 02/01/2024 06:04:56 PM
- Africa’s Largest Gold Mine Now Also One of Its Greenest • GlobeNewswire Inc. • 01/29/2024 04:00:00 PM
NanoViricides Reports that the Phase I NV-387 Clinical Trial is Completed Successfully and Data Lock is Expected Soon • NNVC • May 2, 2024 10:07 AM
ILUS Files Form 10-K and Provides Shareholder Update • ILUS • May 2, 2024 8:52 AM
Avant Technologies Names New CEO Following Acquisition of Healthcare Technology and Data Integration Firm • AVAI • May 2, 2024 8:00 AM
Bantec Engaged in a Letter of Intent to Acquire a Small New Jersey Based Manufacturing Company • BANT • May 1, 2024 10:00 AM
Cannabix Technologies to Deliver Breath Logix Alcohol Screening Device to Australia • BLO • Apr 30, 2024 8:53 AM
Hydromer, Inc. Reports Preliminary Unaudited Financial Results for First Quarter 2024 • HYDI • Apr 29, 2024 9:10 AM

