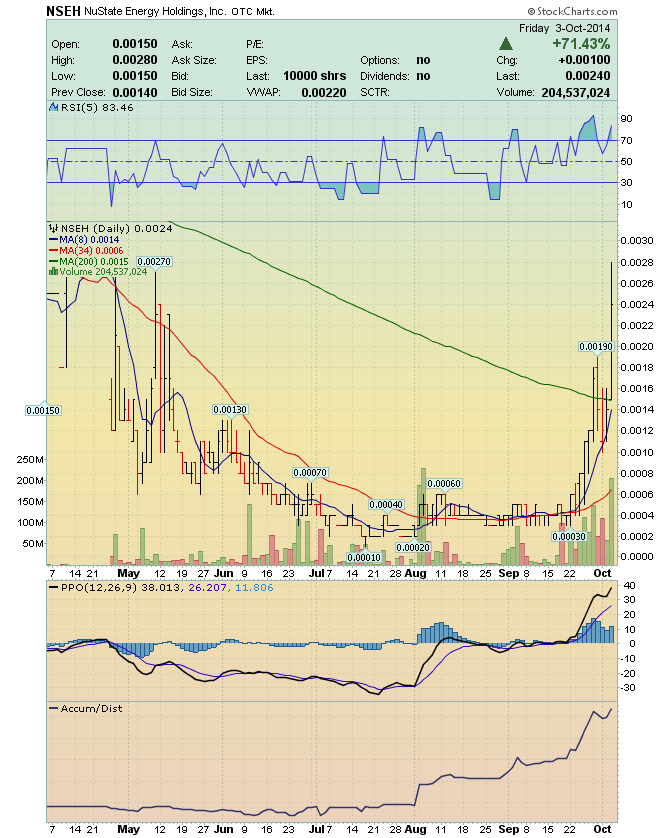
FRZT - Will Climb like ARCS and NSEH Chart Pattern Comparison Analysis FRZT - Target 0.0018 / 0.002 / 0.003 / 0.004 http://www.allotcbb.com/quote.php?symbol=frzt http://www.investorpoint.com/stock/FRZT-Freeze+Tag+Inc/market-makers-level2/ http://www.investorpoint.com/stock/FRZT-Freeze+Tag+Inc/price-history/ ARCS - Targets 0.0016 / 0.0028 http://www.allotcbb.com/quote.php?symbol=ARCS http://www.investorpoint.com/stock/ARCS-Arcis+Resources+Corp./market-makers-level2/ http://www.investorpoint.com/stock/ARCS-Arcis+Resources+Corp./price-history/ http://investorshub.advfn.com/uimage/uploads/2014/10/3/yyfipNSEH_Chart_2.png https://www.stockscores.com/chart.asp?TickerSymbol=ARCS&TimeRange=180&Interval=d&Volume=1&ChartType=OHLC&Stockscores=1&ChartWidth=830&ChartHeight=500&LogScale=None&Band=None&avgType1=SMA&movAvg1=8&avgType2=SMA&movAvg2=34&Indicator1=RSI&Indicator2=PPO&Indicator3=AccDist&Indicator4=MFI&endDate=&CompareWith=&entryPrice=&stopLossPrice= http://www.stockscores.com/chart.asp?TickerSymbol=FRZT&TimeRange=365&Interval=d&Volume=1&ChartType=OHLC&Stockscores=1&ChartWidth=830&ChartHeight=500&LogScale=None&Band=None&avgType1=SMA&movAvg1=8&avgType2=SMA&movAvg2=34&Indicator1=RSI&Indicator2=PPO&Indicator3=AccDist&Indicator4=MFI&endDate=&CompareWith=&entryPrice=&stopLossPrice= http://investorshub.advfn.com/uimage/uploads/2014/10/3/yyfipNSEH_Chart_2.png http://www.stockscores.com/chart.asp?TickerSymbol=ARCS&TimeRange=180&Interval=d&Volume=1&ChartType=OHLC&Stockscores=1&ChartWidth=830&ChartHeight=500&LogScale=None&Band=None&avgType1=SMA&movAvg1=8&avgType2=SMA&movAvg2=34&Indicator1=RSI&Indicator2=PPO&Indicator3=AccDist&Indicator4=MFI&endDate=&CompareWith=&entryPrice=&stopLossPrice= http://www.stockscores.com/chart.asp?TickerSymbol=FRZT&TimeRange=180&Interval=d&Volume=1&ChartType=OHLC&Stockscores=1&ChartWidth=830&ChartHeight=500&LogScale=None&Band=None&avgType1=SMA&movAvg1=8&avgType2=SMA&movAvg2=34&Indicator1=RSI&Indicator2=PPO&Indicator3=AccDist&Indicator4=MFI&endDate=&CompareWith=&entryPrice=&stopLossPrice= http://investorshub.advfn.com/uimage/uploads/2014/10/3/yyfipNSEH_Chart_2.png http://www.stockscores.com/chart.asp?TickerSymbol=ARCS&TimeRange=365&Interval=d&Volume=1&ChartType=OHLC&Stockscores=1&ChartWidth=830&ChartHeight=500&LogScale=None&Band=None&avgType1=SMA&movAvg1=8&avgType2=SMA&movAvg2=34&Indicator1=RSI&Indicator2=PPO&Indicator3=AccDist&Indicator4=MFI&endDate=&CompareWith=&entryPrice=&stopLossPrice= http://www.stockscores.com/chart.asp?TickerSymbol=FRZT&TimeRange=720&Interval=d&Volume=1&ChartType=OHLC&Stockscores=1&ChartWidth=830&ChartHeight=500&LogScale=None&Band=None&avgType1=SMA&movAvg1=8&avgType2=SMA&movAvg2=34&Indicator1=RSI&Indicator2=PPO&Indicator3=AccDist&Indicator4=MFI&endDate=&CompareWith=&entryPrice=&stopLossPrice= http://investorshub.advfn.com/uimage/uploads/2014/10/3/yyfipNSEH_Chart_2.png
 News
News  Market Data
  Discover