


Sunday, September 25, 2016 9:44:31 AM
Well, what appears to be consolidation continues and my "mildly bullish bias" is at risk with the appearance of the AH filing for increased shares to be sold "At The Market" (ATM). This filing needs to be followed in short order by a major sale PR to retain any hope for any near-term appreciation. Otherwise I think we have to assume it's just to keep the doors open a bit longer. Of course management would tell us it's to strengthen their balance sheet, a futile effort, to engender customer confidence in the viability of the company.
I see several things related to this.
First I suspect the results from the Rodman & Renshaw presentation failed to attract any investors for a private placement, even at a discount to market. Then, beyond the obvious need for a cash infusion to keep the doors open, I guess management recognizes the weakness in the market will not allow enough cash to be generated from the current offering quantity at current prices. Last, I suspect ATM use will no longer be limited to the $1.4x and higher range that appears to be the price range used in the past.
An implication I draw from these suppositions is that management is not expecting to meet their $100MM/year(?)/$25MM(?)/quarter break-even point in the time-frame they have been anticipating.
Trying to be not all "Debbie Downer", I admit the possibility that a big order has been (or is expected to be) obtained and the cash is needed to fund production for that order. That would produce, eventually, the catalyst PR that is needed so badly to produce some market confidence.
Any odds on that given the history?
Given all the above I have a hard time thinking that we'll hold in this consolidation pattern regardless of what the below stuff suggested. It was all on a Friday and before the filing was announced.
Well, after the market close $CPST started setting up for more dilution. Let's hope early next week there's a big fat positive PR that justifies the money for other than pay checks.
Keep in mind that all the below maybe be a "Friday effect", which often includes low volume and little movement.
Although not completely flat, the day did have mostly flattish behaviour in four segments. All on extremely low volume. Given the low volume, the behavior is not unusual as MMs make money from volume and arbitrage.
We opened low, $1.39, and went sideways there, but for 9:33's 10K $1.38 (day's low), until 10:18 began a push up, on almost no volume, to 10:24's $1.42, the day's high. Then very low/no-volume $1.41/2 through 13:04 was followed by a very low/no-volume flat $1.40/1 through 14:44. 14:45 did a 16K plummet to $1.38, hitting the day's low again, and proceeded on very low/no-volume flat $1.38/9 to the close at $1.39.
After the SEC filing there was a late (18:08) 750 share sell for $1.38. The size and appearance after the filing was posted makes me think this was not manipulation, although it could still foretell coming attractions, being at the day's low and below the close.
There were no pre-market trades.
Just prior to the open b/a was 700:2K $1.35/42.
09:30-10:13 opened the day with a 254 unknown and 16 more for $1.39. Immediately after open the b/a was 700:1.7K $1.38/42. Then came 9:32's ~1.5K $1.40->$1.3956 (312), 9:34's b/a 1.4K:1.8K $1.38/42, 9:34's 10K block $1.3810, 9:40's 2K $1.3943, 9:41's 300 $1.40, 9:41's b/a 2.2K:1.6K $1.39/40. That began very low/no-volume $1.39/40, mostly pecking the offer with 100/200 shares sporadically, but for 9:39's interruption of the price range with a 100 $1.38. B/a at 09:55 was 1.8K:2.2K $1.39/40, 10:00 3.1K:2.3K $1.38/40.The period ended on 10:13's 228 $1.40.
10:14-13:04, after five no-trades minutes, began very low/no-volume $1.41/2, with a few initial minutes of 100-share pecking the offers, on 10:18's ~1.9K $1.40-$1.41. B/a at 10:20 was 5.5K:3.2K $1.40/2, 10:24 900:2.5K $1.4/2, 10:35 1.1K:4K $1.41/2, 10:57 1.8K:4.1K $1.41/2. Pecking began including bids and mid-points ~11:00 along with normal trades. Volume was interrupted by 11:03's ~4.6K $1.4132 (~4.5K)->$1.4150. B/a at 11:11 was 1.8K:4.4K $1.41/2, 11:21 1.7K:4.6K $1.41/2, 11:58 800:5.1K $1.41/2, 12:47 600:9.4K $1.41/2. The period ended on 13:04's 100 $1.41.
13:05-14:41 began very low/no-volume $1.40/1, with a lot of 100-share pecking of the offers, on 13:05's ~1.5K $1.41 (500)->$1.4035 (499)->$1.40 (499). B/a at 13:23 was ~6.1K:2.8K $1.40/1, 13:53 6.2K:3K $1.40/1. Volume was interrupted by 13:56-:57's 5.9K $1.4036 (3.4K)->$1.4015->$1.4014 (1.9K). B/a at 14:04 was 6.1K:3.4K $1.40/1. The period ended on 14:41's 200 $1.4036.
14:42-14:45, after three no-trades minutes, did a drop on 14:45's 16.2K $1.40->$1.4050->$1.40->$1.39->$1.38.
14:46-16:00 began very low/no-volume $1.38/9 on 14:46's 100 $1.38. B/a at 15:05 was 16.2K:4.9K $1.38/9, 15:21 16K:5.2K $1.38/9, 15:42 16K:3.7K $1.38/9, 15:54 24.1K:3K $1.38/9. The period and day ended on 15:59's 245 $1.39 and 16:00's 1,252 buy for $1.39 - flat from yesterday.
There was one AH 750 share sell for $1.38 at 18:08. This is very unusual for a Friday. Maybe related to the filing?
Excluding the opening and closing trades (didn't qualify), there were 3 larger trades (>=5K & 1 4K+) totaling 22,450, 28.03% of day's volume, with a $1.3942 VWAP. These and the volume are not bullish. But do recall I warned that Friday's are often flat or weak and in the past mentioned they were often low-volume too.
Note how the VWAP held up pretty well until the last period and the buy percentage, although low overall, tried to struggle upward as the VWAP weakened a bit. Yesterday I noted the these didn't show any real strength, or weakness either. I assess today as the same - tried to sow some strength but couldn't pull it off. But neither did it show any big signs of weakness in the intra-day behavior.Ending Period Period Period __Per. Trade_ Period_ % Day_ Per. End
Period Volume Low High _Dollar Val._ VWAP___ Volume Buy ~%
10:13 15074 $1.3800 $1.4000 $20,893.29 $1.3860 18.82% 29.43% Incl 09:34 $1.3810 10,000
13:04 21386 $1.4000 $1.4200 $30,231.85 $1.4136 26.70% 38.05% Incl 11:03 $1.4132 4,450
14:41 13198 $1.4000 $1.4100 $18,541.57 $1.4049 16.48% 36.03%
14:45 16226 $1.3800 $1.4050 $22,684.35 $1.3980 20.26% 39.57% Incl 14:45 $1.4000 8,000
16:00 12517 $1.3800 $1.3900 $17,343.31 $1.3856 15.63% 43.02%
18:08 750 $1.3800 $1.3800 $1,035.00 $1.3800 0.94% 42.62%
On the traditional TA front, movements were:
Well, the low held flat, the high was down only marginally ($0.0072) and the close held flat, also the same as the open. The reducing volume, combined with a day either flat or down depending on which numbers you consider most significant, suggests no strength in whichever move you view as under-way. Typical consolidation behavior.__Open_ ___Low_ __High_ _Close_ Volume_
Today -2.11% 0.00% -0.50% 0.00% -58.46%
Prior 5.97% 3.37% -0.20% -2.80% 15.44%
Time for a new minimal chart.

On my minimal chart, today our low again touched upon the rising longer-term support (rising white line) which had been broken four days prior, 9/19, along with the $1.34 support (horizontal blue line). The following day confirmed both breaks.
Recall I suggested the ATM had been in use and that when we broke below $1.4x the ATM use would end, based on historical behavior when I was much more certain it was being used. Sure enough, on the third day price moved back above the $1.34 and rising longer-term supports and confirmed the following day. Since 9/19 I've not noticed anything making me think the ATM was in use.
Anyway, the second consecutive day of our low touching the longer-term rising support on low, and today very low, volume leads me to see the behavior as re-entering short-term consolidation until "the market" decides that shares are worth more or less than the current price range. Let's hope the ATM expansion linked above is followed by some very positive PR to offset the negative implications of that.
The high was down only marginally ($0.0072) and the close held flat at the opening price. Combined with a spread of only four cents this also suggests near-term consolidation.
The converging experimental 13-period Bollinger band limits supports this. As mentioned, the limits are rapidly approaching the area that would suggest a substantial move will occur.
The open and close at the low forms a Gravestone Doji that is believed to signal indecision and a likely bearish reversal during an up trend. Bulkowski notes this reversal occurs only 51% of the time - essentially random. He also notes { However, after an upward breakout in a bear market, price moves higher by 5.09% in 10 days, which is quite good. When you consider that price closed at the bottom of this candlestick, the climb is even higher (because I measure from a close above the top of the candlestick as the breakout, and do not start counting from the bottom of the doji). Using the height of the candle projected in the direction of the breakout shows that the trend meets the predicted target 79% of the time, which I consider acceptable. }
On my one-year chart the 20-day SMA got below the 50-day. The 10-day is below the 200, the 20-day is falling and the 50-day is still rising. We've traded below the 200-day beginning 9/9. Fortunately we've had higher lows 4 of the last 5 days, giving me a mild bullish take on this consolidating behavior. Regardless, if we hold the current range the 10 and 20-day will continue declining, the 20 quite rapidly and could be expected to go below the 200-day in roughly a week. If we hold this range the 50-day will go flat/mildly rising for three days. Then we need to close at $1.45 to keep the 50-day from beginning to decline.
The oscillators I watch, yesterday mixed with a slightly bearish bias, continued mixed but with a less bearish stance IMO. ADX-related, RSI, momentum and accumulation/distribution weakened, and those only marginally so. Each is below neutral. MFI (untrusted by me) rose and is near exiting oversold. Williams %R and full stochastic rose with the former a bit further above oversold and the latter well above neutral now.
The only fly in this slightly more bullish view is the reducing volume. But that's not unusual during consolidation and/or indecision, as indicated by the Gravestone Doji detailed above.
The experimental 13-period Bollinger limits, $1.3196 and $1.4958 ($1.3007 and $1.5439 yesterday), as mentioned above, are converging and nearing a point that suggests a move is likely near.
Keep in mind that all the above maybe be a "Friday effect", which often includes low volume and little movement.
All in, there's signs of improvement but not yet enough to make me think we're exiting consolidation. I do maintain my "mildly bullish" assessment though due to the break and confirmation above a rising longer-term support and the beginning improvements in the oscillators.
Percentages for daily short sales and buys moved in opposite directions, not good, and the short percentage fell further below my desired range (needs re-check). The buy percentage got a nice bump from yesterday's low percentage but is still below the range needed for sustained appreciation.
The spread moved further into a narrow "consolidation" range, suggesting no big near-term move is yet likely.
Note that the VWAP barely moved, also suggesting consolidation.
Keep in mind that all the above maybe be a "Friday effect", which often includes low volume and little movement.
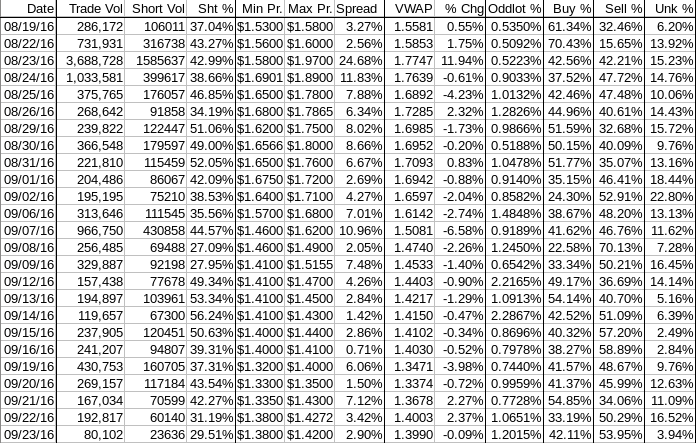
The VWAP's last twenty-four readings deteriorated from 17 negative and 7 positives to 18 and 6 respectively. Change since 08/19 is -$0.1591, -10.21%, and the averages of the rolling 24-day period seen in the last few days (latest first) finally couldn't hold the improvement seen yesterday and are now -0.3949%, -0.3681%, -0.3757%, -0.5054%, -0.4416%, -0.2697%, -0.2275%, -0.1731%, -0.1117%, and -0.1021%.
All in, this stuff continues suggesting nothing more than continued consolidation. For the moment there is no sign of a "mildly bullish bias".
Bill
Join the InvestorsHub Community
Register for free to join our community of investors and share your ideas. You will also get access to streaming quotes, interactive charts, trades, portfolio, live options flow and more tools.

