


Thursday, September 22, 2016 9:49:24 AM
I suspect we now see a rise, but not because of any TA. I suspect this because of the intra-day behavior, detailed below, and our history of ATM usage in the $1.40 and above range, cessation below that level, a rise and then ATM use again. Of course the identification of ATM use is both subjective and certainly uncertain.
The initial b/a behavior switched from buy imbalance to sell imbalance as a 24K $1.35 offer popped up right at the open and sat there, often with no other offers seen, until about 10:30 when other exchanges appeared on the offer. I suspect this was someone "capping" the upside, maybe to let someone accumulate. This seems more likely with what happened 14:10-:19 when price was pushed up on "big" volume (~50.6K, 30.28% of day's volume) with a $1.3661 VWAP, the b/a quantities became both more variable and occasionally more balanced, and the late in the day we had an unusually large closing block four cents above the 15:59 trades.
Other than that, the open until that period was absolutely low-volume flat $1.3350-$1.35 accounting for ~60.7K, 36% of day's volume, over about 4.5 hours with a VWAP of $1.3454.
So we can envision a scenario of MMs capping the price while accumulating at a VWAP of $1.3454 and selling to a buyer (a good customer, maybe a covering shorter?) for a VWAP of $1.3661.
This intra-day behavior suggests the conventional TA which is seen as positive today, other than the low volume, is misleading.
There were no pre-market trades.
09:30-14:09 opened the day with a 113 sell for $1.34. Then came 9:31's 446 $1.34/5 (223 ea.), 9:31's b/a of 5.1K:24K $1.33/5, 9:32's 800:24.6K $1.34/5, 9:36's 4.7K $1.3401 (4K)->$1.34, 9:38's 1.1K $1.34/5, 9:39's 535 $1.3450/$1.35, 9:42's b/a 1.2K:24K $1.34/5. With that 4K offer in place very low/no-volume $1.34/5 (mostly $1.3450 through $1.35) was traded until 10:09 widened to $1.34/5.
B/a at 9:55 was 3.3K:22K (one offer) $1.34/5, 10:06 3.2K:31.7K $1.34/5, 10:39 3.9K:31.9K, 10:53 2.5K:31.3K $1.34/5. Volume was interrupted by 11:02-:03's 7.3K $1.3499/$1.35->$1.3440/$1.35.
B/a at 11:07 was 3.4K:24K $1.34/5. Volume was interrupted by 11:16's 4.2K $1.34. B/a at 11:24 was 12.8K:6.2K $1.33/4. Volume went near nil.
Price was interrupted by 11:32's 225 $1.3350. B/a At 11:38 was 12K:6.6K $1.33/4, 11:47 1.9K:24.7K $1.34/5, 12:07 8.3K:24.4K $1.34/5, 12:33 7.9K:26.6K $1.34/5. At 12:46 most trades began going $1.34 to $1.3450.
B/a at 13:03 was 8.7K:24.2K $1.34/5. Volume was interrupted by 13:14's 7/K $1.34. Most trades went $1.34 to $1.35 (because pecking the offer began, 100/200 shares every couple minutes) beginning at 13:18. B/a at 13:18 was 7.8K:24.2K $1.34/5, 13:41 8.1K:24K $1.34/5, 13:50 8K:24.2K $1.34/5. The period ended on 14:09's 100 $1.35.
14:10-14:19, after four no-trades minutes, did a very large jump up on 14:13's ~32.7K (incl a couple 8K and 5K blks) $1.3490->$1.35->$1.3450/$1.3498->$1.35->(gap to)$1.37, 14:15's 510 (gap) $1.39->$1.40, went medium-volume $1.39/40 until 14:19's ~9.5K $1.3943->$1.40->$1.3901.
14:20-16:00, after one no-trades minute, began a small fall on 14:21's 100 $1.40, hit 14:22's 694 $1.39->$1.39 and 14:41's 100 $1.3710. Then very low/no-volume $1.37/9 began on 14:41's 100 $1.3710. B/a at 14:52 was 1K:2.8K $1.37/9, 15:10 1.5K:500 $1.37/8, 15:15 200:11.1K $1.39/40. Price was interrupted by 15:16-:15:25's ~7.8K $1.3950->$1.3990->$1.39->$1.40->$1.39. Range then came back to $1.38/9, very low/no-volume, of course. B/a at 15:19 was 100:9.7K $1.39/40, 15:32 300:4.4K $$1.38/9, 15:50 915:12.3K $1.39/40. price was interrupted again by 15:54's 1.4K $1.39/$1.40 (100). B/a at 15:57 was 1.8K:10.8K $1.39/40, 15:58 1.3K:3.3K $1.38/9. The period and day ended on 15:59's 2.3K $1.39 and 16:00's 10.4K $1.43, four cents above the 15:59 ending trade price.
There was one AH sell at 16:03 of 100 for $1.35.
Including the closing trades (opening didn't qualify), there were 6 larger trades (>=5K) totaling 44,311, 26.53% of day's volume, with a $1.3709 VWAP. Excluding the closing trade, there were 5 larger trades totaling 33,912, 20.30% of day's volume, with a $1.3528 VWAP. These seem reasonably normal in both count and percentage of day's volume. The one exceptional item is the exceptionally large size of the closing block. Notice the effect of that high-priced trade on VWAP.
On the traditional TA front, movements were:Ending Period Period Period __Per. Trade_ Period_ % Day_ Per. End
Period Volume Low High _Dollar Val._ VWAP___ Volume Buy ~%
14:09 60655 $1.3350 $1.3500 $81,604.18 $1.3454 36.31% 48.76% Incl 13:14 $1.3400 7,500
14:19 50577 $1.3450 $1.4000 $69,090.99 $1.3661 30.28% 63.25% Incl 14:13 $1.3490 8,000 $1.3500 8,000
14:13 $1.3500 5,087
16:00 54421 $1.3710 $1.4300 $75,889.83 $1.3945 32.58% 57.66% Incl 14:24 $1.3832 5,325 16:00 $1.4300 10,399
16:03 100 $1.3500 $1.3500 $135.00 $1.3500 0.06% 57.63%
On my minimal chart our low honored the $1.34 potential support which was broken by yesterday's close. Further, our close was back above the longer-term rising support, which was $1.37 a few days back and now seems to be ~$1.38. The experimental Bollinger limits are still converging but the lower limit is rising less quickly than the upper limit is falling, moving the mid-point lower.__Open_ ___Low_ __High_ _Close_ Volume_
Today -0.74% 0.38% 5.93% 7.52% -37.94%
Prior -3.57% 0.76% -3.57% 0.00% -37.51%
The apparent bullish behavior of breaking above both potential support/resistance points ($1.34/8) is belied by the volume, down ~38%. Regardless, if only TA is considered this offers the suggestion of near-term bullishness. One would want to see continued price improvement on increasing volume as an indication of strength in the move.
The intra-day manipulation laid the wood to yesterday's { ... seems consistent with a short sideways move starting ... also suggesting we'll do a short sideways move for now ... }
On my one-year chart the 20-day SMA did not fall below the 50-day SMA, thanks to the manipulation observed. However, it was likely a one-day save as a $1.74 close falls out of the window tomorrow. So it should cross below.
The oscillators I watch all improved, all but MFI (untrusted by me) exited oversold, all that were at their lower bounds are above that level, only momentum is above neutral.
The 13-period Bollinger limits, $1.2755 and $1.6075 ($1.2496 and $1.6735 yesterday) are converging and still dropping the mid-point,.
All in, if not for the obvious intra-day manipulation, everything is coming up roses ... but for the declining volume. But as mentioned above, the TA matters not - the ATM cycle refresh should continue if my assessment of past behavior is correct.
Percentages for daily short sales and buys moved in opposite directions but that makes no difference today and neither does the short percentage moving from the high to near the middle of the desired range (needs re-check). Likewise, the buy percentage strength (which was lousy until the 14:10-:14:13 period did its magic) doesn't matter but for we can look forward to it continuing for a while as the manipulation continues.
The spread is both wide and irrelevant.
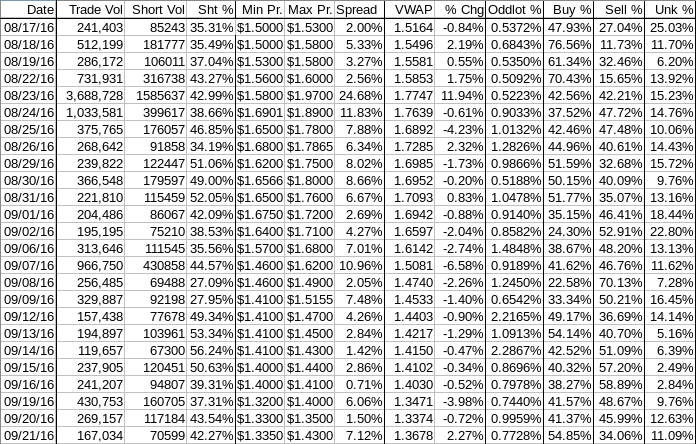
The VWAP's last twenty-four readings improved, going from 18 negatives and 6 positives to 17 and 7 respectively. Change since 08/17is -$0.1485, -9.80%, and the averages of the rolling 24-day period seen in the last few days (latest first) continue worsening and are -0.3757%, -0.5054%, -0.4416%, -0.2697%, -0.2275%, -0.1731%, -0.1117%, -0.1021%, -0.0088%, and 0.2908%.
All in, if not for the intra-day manipulation this would suggest near-term improvement.
Bill
Join the InvestorsHub Community
Register for free to join our community of investors and share your ideas. You will also get access to streaming quotes, interactive charts, trades, portfolio, live options flow and more tools.

