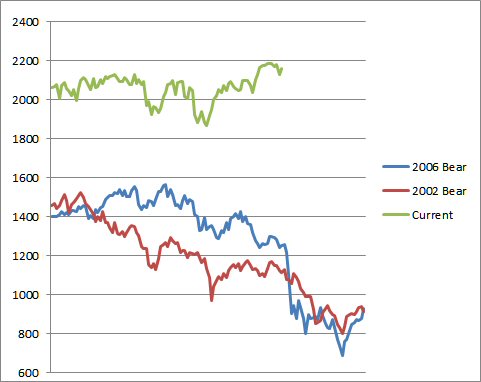
Hi Gang, As of last Friday the 47 ETFs I had on one list, all but two had gained, one was no change and one had a small loss. Monday all were losers but one small gainer. Today they were all losers. So I decided to try to create a chart that might reflect where we are in the Bull/Bear cycle using Yahoo's ^GSPC S&P 500 numbers. It was easy to match up the lowest weekly close for the 2002 and 2006 bear market. The low was $800.37 at week end 9/3/2003 and the low was $683.38 at week end 3/2/2009.
Then I grabbed the data and made two charts, attempting to see if I could match up the current with the previous two.
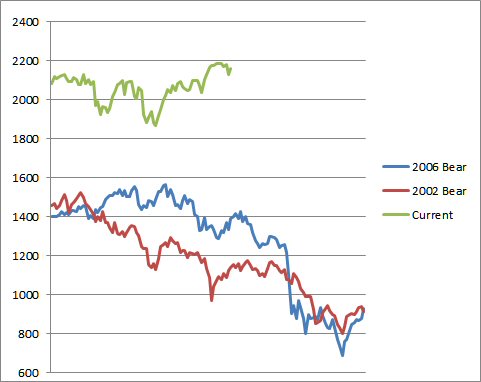
This is the first version. The beginning dates for the 2002 market is 6/5/2000 and 11/13/2006 2006 market. The end dates are 12/2/2002 for the 2002 bear and 5/9/2009 for the 2006 bear market. The beginning of the Current chart line in the first image is 10/27/2014 and 4/13/2005 for the second image and the end date for both is last Friday, 9/12/2016.
Here is the second version. I'm making a wild ass guess that we have not quite hit the beginning of the next bear market as there still seems to be some upward move possible. Hindsight is always easier, alas. However, if what all the pundits are saying has a grain of truth in it September is supposed to be a down month, but then, you know pundits, more wrong than right most of the time, especially the cross-talk between them.
Excel makes it difficult to cover a much longer period so matching baselines is almost impossible and inexact.
Register for free to join our community of investors and share your ideas. You will also get access to streaming quotes, interactive charts, trades, portfolio, live options flow and more tools.
 News
News  Market Data
  Discover