spy bullish Failure Swing bottom buy point ....by art hill
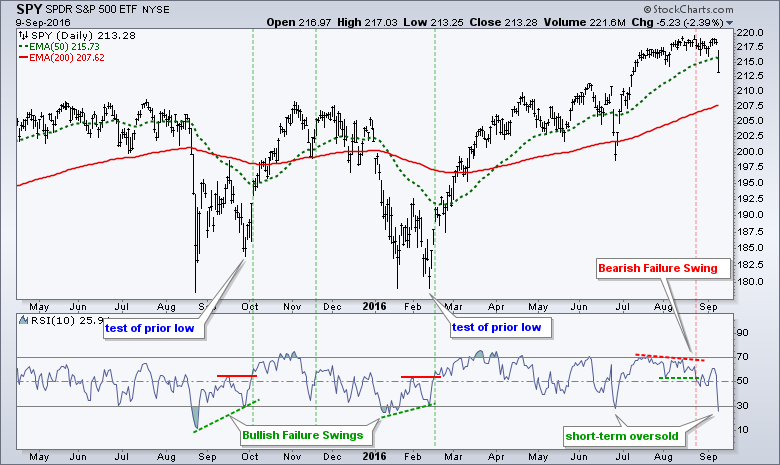
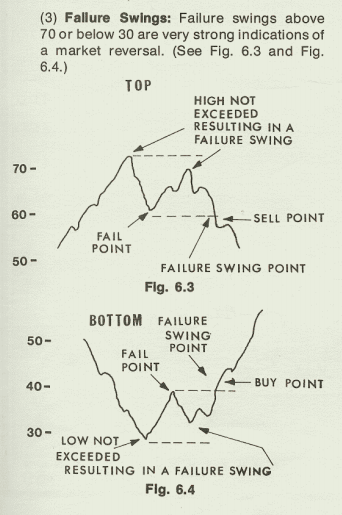
How might a settling process evolve? The chart above shows SPY with 10-day RSI in the indicator window. After the breakdowns and 10+ percent declines in August 2015 and January 2016, it took the market a little over a month to settle and ultimately reverse. Bullish Failure Swings marked the reversals in October and February. These were identified by Welles Wilder, creator of RSI, and detailed in his book: New Concepts in Technical Trading Systems (1978). A bullish Failure Swing occurs when RSI moves below 30, bounces above 30, pulls back, holds above 30, and then clears its prior high. This occurred in August-September and January-February. Notice that SPY had time to settle and tests its prior low during this process. Thus, a few more weeks of uncertainty could lead to some sort of deep dip, test of support and a bullish Failure Swing. RSI is currently oversold so the first part of the equation is in place. Before leaving RSI, notice that there was a Bearish Failure Swing in late August. The image below comes from Wilder's book.
Register for free to join our community of investors and share your ideas. You will also get access to streaming quotes, interactive charts, trades, portfolio, live options flow and more tools.
 News
News  Market Data
  Discover