


Sunday, September 11, 2016 5:07:17 PM
As I posted elsewhere, Phew! What a stink. 14:46-16:00 ~209.4K, 63.47% of days vol, $1.46->$1.41, -3.42% drop. Rising vol too, but today doesn't bother me. Why doesn't it bother me? Because of yesterday's { Conventional and unconventional suggestions are so bad I have managed to convince myself we have hit the bottom and will shortly begin a reversal. So I'm near-term bullish. } All the stuff I watch was telling me things weren't good, and are continuing to do so, which is why today's stink and volume doesn't bother me much. It suggests I have some understanding of what's going on behind the curtain. Now I just need to learn to respond appropriately.
If I had predicted upside based on what I thought they were saying instead of why I did so - because I'm ornery and contrary, as my grandpa used to tell me - I would be concerned.
I'm suspecting today was the "last gasp flush" of those late to get out and/or the MMs shorting at high prices all day long, suggested by decent intra-day buy percentages (see below), and then dumping price to trigger stop-losses and do their covering buys. This could be part of the process of taking care of a "good customer" that wanted to sell at a price above what the market would naturally support.
So, tomorrow should be up!

Having said that, I still believe we are nearing a bottom and see the minimal chart's longer-term rising support (rising white line), currently at ~$1.37 and rising about ~$0.01/week, as a possible near-term test and support if we do continue lower. I plan to finish filling my trading blocks position if we get there and show signs of reversal. If we don't go down and challenge it I'll just let my current positions ride and take profits at some reasonable point.
If we use just a reversion to the mean, that would look to be in the vicinity of ~$1.57. A little overshoot would probably get us $1.60. Small profit, but better than a stick in the eye. If my position was filled I'll sell 1/2 and hang on to the other portion until better results are available.
A change today is that the pecking was mostly on the offers, not the bids, until around 14:30. This showed up in the buy percentages which maintained much better readings (see below) until ~14:35 switched to more hitting of the bids. This was shortly before the MMs (or whomever did the dastardly deed late in the day) had it all set up and dropped the axe.
There were no pre-market trades.
09:30-10:02 opened the day with a 4,924 buy and 2 more unknowns totaling 2,436, all @ $1.48. Then came 9:33's 3.1K $1.49->$1.48->$1.4860, 9:37's b/a of 600:100 $1.48/50, 9:38's 100 $1.50, 9:39's 1K:4.6K $1.49/52, 9:42's 775 $1.4950->$1.4992, 9:43's b/a 7K:8.9K $1.50/1, 9:44's ~6K $1.50/$1.5001 (2 x 2950 MM pass through?), 9:48's 100 $1.51, 9:49's ~8.2K $1.50/$1.5050, 9:50's 200 $1.50, 9:54's 428 $$1.50/$1.5032, 9:55's 2.8K $1.50, 9:58's ~5.1K $1.4999 (2 x 2.5K MM pass through?), 10:01's 100 $1.50, 10:02's b/a of 11.4K:2.4K $1.48/50. The period ended on 10:02's 666 (MM signal to other MMs?) $1.4824.
10:03-10:51 began very low/no-volume $1.48/9 on 10:08's 1K $1.4836. B/a at 10:05 was 11.4K:2.4K $1.48/50 (unchanged), 10:17 11.8K:2.3K $1.48/50, 10:36 11.9K:3.7K $1.48/9. The period ended on 10:51's 100 $1.49.
10:52-11:25 began very low/no-volume $1.47/8 on 10:52's ~21.2K (incl 10K, & 2 x 4K+ that look like part of a larger trade, all $1.48 blks - 666 forecast correct?) $1.4801->$1.48->$1.4850->$1.47. B/a at 11:03 was 3.2K:3.6K $1.47/8, 11:11 5.5K $1.47/8, 11:17 8.3K:3.6K $1.46/7. At 11:19 range went to $1.4699/$1.47. B/a at 11:25 was 8K:3.6K $1.46/7 and 11:25's 100 $1.47 ended the period.
11:26-12:50, after six no-trades minutes, began very low/no-volume $1.47 flat on 11:31's 200 $1.47->$1.4680. B/a at 11:36 was 10.7K:3.7K $1.46/7, 11:51 9.9K:4.5K $1.46/7. 11:52 range was moved to $1.4633/$1.47 ($1.4633 making the low for the day thus far) with almost all $1.47 though. B/a at 12:00 was 10.4K:4.1K, 12:33 10.2K:3.8K $1.46/7. The period ended on 12:50's 16.2K (incl 9.8K, 5.2K $1.47 blks) $1.4684(100)/$1.47.
12:51-15:07 began in the same range but it was widened by 12:54's 510 $1.4616 (260 shares new low) -> $1.47. B/a at 12:56 was 10.5K:3.8K $1.46/7. Range again widened on 13:07-:08's 1.1K $1.4650->$1.46 (new low). B/a at 13:11 was 8.9K:5.1K $1.46/7, 13:43 10.4K:3.5K $1.46/7, 14:14 8.9K:4.9K $1.46/7, 14:23 11K:3.4K $1.46/7.
At ~14:35 the trades began hitting the bids most often, meaning most trades were now $1.46 instead of $1.47. B/a at 14:44 was ~9.2K:3K $1.46/7. The period ended on 15:07's 100 $1.4650.
15:08-15:10, after one no-trades minute, did a round-trip on 15:09-:10's 55.5K $1.4650->$1.47->$1.4650/$1.47->$1.46->$1.45->$1.47.
15:11-15:36 began with ten no-trades minutes during which b/a at 15:17 was 22.7K:8K $1.45/7. Then began a very low/no-volume sag on 15:20's 100 $1.47, going $1,47->$1.4649/$1.47->$1.45. B/a at 15:28 21.2K:10.1K $1.45/7, 15:35 22.6K:10.1K $1.45/7. The period ended on 15:36's 101 $1.45.
15:37-15:43, after two no-trades minutes, did a large drop on 15:39-:43's ~78.1K (23.68% of day's volume) $1.45/$1.4510->$1.44->$1.43->$1.4550->$1.43->$1.4367->$1.43->$1.4242->$1.42->$1.41.
15:44-16:00 began high-volume $1.41/3 on 15:44's ~11.7K's $1.41/2 and ended the period and day with 15:59's 787 $1.41/2 (100) and 16:00's 400 sell for $1.41.
There were no AH trades.
Excluding the opening and closing trades (didn't qualify), there were 15 larger trades (>=5K) totaling 129,489, 39.25% of day's volume, with a $1.4462 VWAP, below the day's $1.4533. The count is fairly normal but the percentage of day's volume is high. As you can see from the breakdown that's mostly because of the dump that came in the last half hour of the day.
As you can see the action held up pretty well, with decent buy percentages and VWAP fairly steady 11:26-15:36. A little more detail will illustrate it better.Ending Period Period Period __Per. Trade_ Period_ % Day_ Per. End
Period Volume Low High _Dollar Val._ VWAP___ Volume Buy ~%
10:02 36601 $1.4800 $1.5155 $54,734.93 $1.4954 11.10% 41.70%
10:51 11334 $1.4801 $1.4975 $16,894.53 $1.4906 3.44% 51.41%
11:25 37660 $1.4699 $1.4850 $55,646.16 $1.4776 11.42% 42.76% Incl 10:52 $1.4801 4,300 4,900 $1.4800 10,000
10:55 $1.4799 5,000
12:50 19900 $1.4633 $1.4700 $29,246.21 $1.4697 6.03% 52.64% Incl 12:50 $1.4700 5,200 9,800
15:07 15523 $1.4600 $1.4700 $22,740.91 $1.4650 4.71% 52.34%
15:10 55312 $1.4500 $1.4700 $80,916.55 $1.4629 16.77% 44.28% Incl 15:10 $1.4600 8,600 $1.4600 11,200
15:36 600 $1.4500 $1.4700 $878.98 $1.4650 0.18% 44.41%
15:43 78032 $1.4100 $1.4550 $111,934.86 $1.4345 23.65% 32.15% Incl 15:39 $1.4510 13,040 15:41 $1.4500 11,562
15:43 $1.4100 8,800 12,000
16:00 72781 $1.4100 $1.4300 $103,317.50 $1.4196 22.06% 33.30% Incl 15:44 $1.4100 10,324 15:54 $1.4110 9,763
15:55 $1.4300 5,000
On the traditional TA front, movements were:.
.
10:51: buy 51.41%, sell 40.67%, unk 07.92% on 48.3K
.
.
12:45: buy 44.11%, sell 51.41%, unk 04.48% on 89.8K
12:50: buy 52.64%, sell 43.56%, unk 03.79% on 106.2K
.
.
15:07: buy 52.34%, sell 43.96%, unk 03.70% on 122.3K
.
.
15:36: buy 44.41%, sell 47.83%, unk 07.76% on 178.4K
Time for a new minimal chart.__Open_ ___Low_ __High_ _Close_ Volume_
Today -0.67% -3.42% 2.01% -4.73% 28.62%
Prior -4.49% 0.00% -8.02% 0.00% -73.47%

On my minimal chart I removed the consolidation triangle (converging red lines) as they are now out of play.
Yesterday I said "... our bottom is at what I call a "pause point" - a place were a move might stop for a bit and could even reverse or move on through later ... Combined with the reducing volume, suggesting reducing strength on this down leg, there's a good possibility of reversal ...".
Well "move on through later" was the result this time. But it took that nasty last hour's ~67% of days volume to do it. I suspect the MMs had held the price up and then seeing the low-volume between 15:11 and 15:38 decided they'd hit the bids hard enough to move range down and trigger stop-losses and do covering buys. The volume during the drop and bounce back 15:08-:10, and final drop 15:36-:44 makes that scenario entirely plausible.
There's other possibilities, such as a general market weakness, traders locking in profits or cutting losses, etc.
Note the long-term rising white line. That's our next potential support and reversal point if we continue lower. Today it's ~$1.37 and rises ~$0.01/week. As with any potential support or resistance, a small overshoot is possible. In this case I would guess $1.35.
A couple days back, while thinking what happens when we reverse, I said { ... we should get at least a "reversion to the mean, about $1.65ish, over a relatively short period. With a little overshoot, not uncommon, we could briefly see $1.67/70 resistance hit briefly ...} With today's new low and assuming this is the bottom, the new target would be around $1.65. A little overshoot would probably get us $1.60-$1.63.
The experimental 13-period Bollinger limits are still diverging with the lower limit dropping faster than the upper limit is rising, resulting in a falling mid-point. We have a history of "pushing" the limits once we contact them if a catalyst or support/resistance is not encountered. Being we just finished a "cupping" pattern in the volume I suspect we may not follow past behavior now. We'll see.
On my one-year chart the 10-day SMA continues to drop. The 20-day SMA, starting to roll over two days ago, began falling today. If we hold the current range the 10 and 20-day SMAs will continue to fall and at an increasing rate. To start rising again we need a "substantial" increase in the closing prices.
Yesterday I noted that if we held our range { the 50-day still has a couple weeks of rise left in it. } Well with today's move if we don't hold here or higher there's a substantial risk of starting to roll over in just a couple days, a possible pause depending on what price range does, and then if we don't start rising substantially within a week or so it'll start falling.
The 200-day SMA is only six cents below.
The oscillators I watch, but for MFI (untrusted by me) which rose, all weakened and all are again below neutral. MFI is barely above oversold while Williams %R and full stochastic are deep in oversold and RSI, which was barely above that condition, is now also in oversold.
Yesterday I iterated the prior day's { This argues for a bottom in or nearly so. Three of four oscillators with an oversold area are there and only RSI remains above it, barely. Today's behavior reinforces that thought and I'll stick with it. } With RSI now in oversold and MFI being barely above I don't have a reason to change my assessment.
The 13-period Bollinger limits, $1.3972 and $1.9043 ($1.4483 and $1.8810 yesterday), continue diverging, again as one would expect with today's behavior.
We seemed to have confirmed one part of yesterday's { I continue thinking we have a suggestion [of] a reversal possibility. Today it's more strongly so due to the items mentioned above. But likely not tomorrow, a Friday? } Now we need to see the other part confirmed.
All in, things look crappy enough to suggest we'll test the $1.37ish level before we reverse but that's not a given considering how we made today's close - 63.47% of day's volume in the last hour-and-a-quarter with a 3.42% drop from $1.46 to $1.41 after having a relatively stable flattish day, with decent buy percentages, until the last hour (see above).
Since I'm quite comfy with being wrong (from much practice), I think I'll take a flyer and say we don't get to $1.37 tomorrow but start the reversal. xx <<---- fingers crossed.
Percentages for daily short sales and buys moved in the same direction, good, but both are well below where they need to be. The short percentage movement was minimal and is still in a range suggesting something abnormal is going on. The buy percentage ending value is not truly indicative of the current situation in my best estimation. See above about it's behavior that, upon some thought, lead me to think the buy percentage at EOD is misleading.
I don't often draw such a conclusion.
The spread is quite wide but we need to keep in mind how and when it was produced by the intra-day action. Under normal circumstances in well-defined down trend it would be ominous. One could look at my minimal chart and wonder { if that's not a down-trend, what is.} Well, I see this as a normal re-trace from an unjustified pop. The trend that will appear is not yet established. A good example of a trend is what preceded the pop for several months.
So I'm discounting this spread for now ... and I'll probably regret it. :(
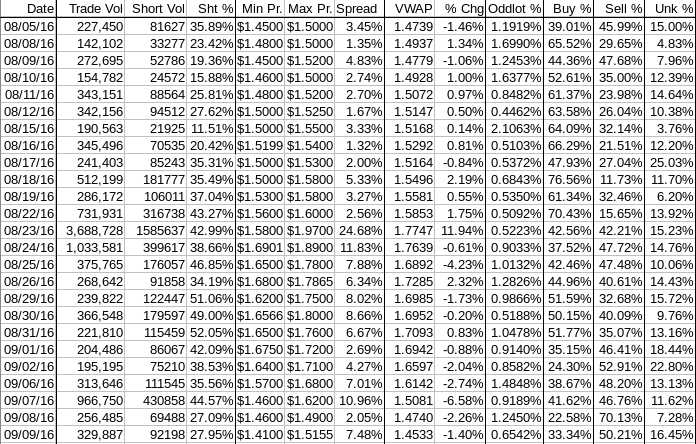
The VWAP's last twenty-four readings held steady at 12 negatives and 12 positives respectively. Change since 08/05 is -$0.0206, -1.40% and the averages of the rolling 24-day period seen in the last few days (latest first) are -0.0088%, 0.2908%, 0.4090%, 0.4975%, 0.5521%, 0.4824%, 0.5606%, 0.7499%, 0.7927%, and 0.3806%. Let's keep an eye out for the rolling averages to start turning up.
All in, after discounting two of my three indicators it would be hubris for me to draw any conclusions. So I'll take the chicken way out and say I'm going neutral until something more concrete and less exceptional develops.
Bill
Join the InvestorsHub Community
Register for free to join our community of investors and share your ideas. You will also get access to streaming quotes, interactive charts, trades, portfolio, live options flow and more tools.

