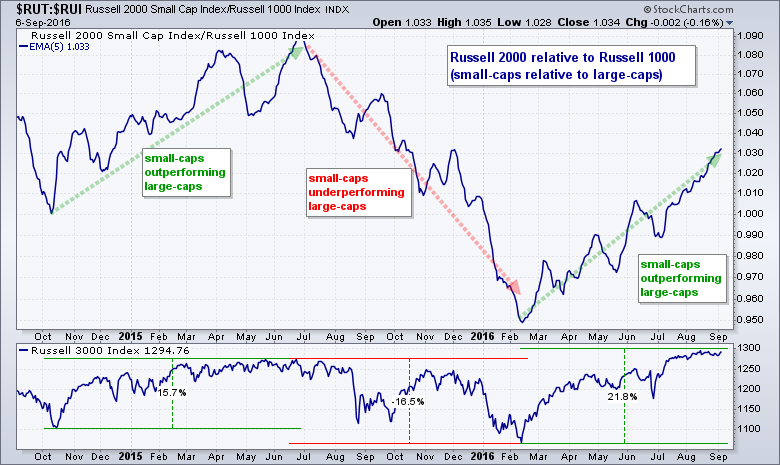
The year started weak for small-caps, but their fortunes quickly turned around in February and this group is now leading the market. The chart below shows the Russell 2000 relative to the Russell 1000 using the price relative ($RUT:$RUI ratio). The Russell 2000 represents the 2000 smallest stocks in the Russell 3000 and the Russell 1000 accounts for the largest stocks. This ratio rises when small-caps outperform large-caps and falls when small-caps underperform large-caps. The green lines mark periods of relative strength and the red line marks a period of relative weakness (April 2015 to February 2016). BY ART HILL
Most recently, notice that this ratio surged in July and August and moved to its highest level of the year. This means the small-caps are outperforming large-caps in 2016 and this is net positive for the stock market. Why? Because small-cap stocks typically have higher betas and they are considered riskier than large-caps. Relative strength in small-caps points to a strong risk appetite for stocks and this is bullish overall.
I added the Russell 3000 to the bottom window so we can see how it performed during periods of small-cap underperformance and small-cap outperformance. Notice that the Russell 3000 rose when small-caps outperformed and fell when small-caps underperformed. This shows a clear correlation between small-caps performance and broad market performance.
Register for free to join our community of investors and share your ideas. You will also get access to streaming quotes, interactive charts, trades, portfolio, live options flow and more tools.
 News
News  Market Data
  Discover