


Tuesday, July 26, 2016 10:37:02 PM
Technical Analysis:
Bulls:
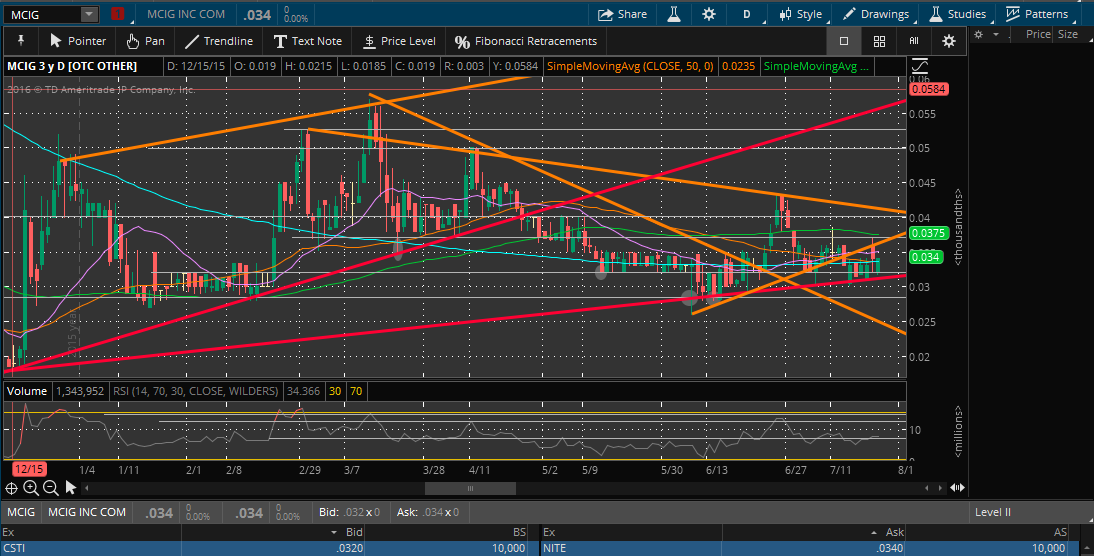
• Higher low @ .026 from bottom @ .0187, thus long-term daily uptrend .0187/.026 *Red Line*
• RSI support @ 42
• Close above 200daySMA @ .0336 *blue line* / 50daySMA @ .0338 *thin orange line*
• Above 50weekSMA @ .0335 *not on daily chart*
• .03-.032 strong price level support
Bears:
• Below 100daySMA @ .0375 *green line* / Below 21daySMA @ .035 *purple line*
• .036 price level resistance
• Strong price level resistance @ .046- .052 (6-tests failed in the last 12 months)
• lower-highs since March
Overall, MCIG chart is currently speaking BULL.
Chart Analysis:
As predicted via my last updates, the 100daySMA was has been the main target being tested at .037-.038 on 7/14 and 7/25. However, these .038 tests have been met with profit taking and still holding us down. Furthermore, MCIG HAS KISSED THE .0187/.026 TRENDLINE (RED) THE PAST 9 SESSIONS. MCIG IS CURRENTLY MOVING UP WITH THIS LONG-TERM CRUCIAL DAILY TREND LINE AS PREDICTED. For the lot of you that thought I was blowing smoke, I hope the chart and red uptrend line can speak on my behalf. I predict we continue to ride up the .0187/.026 trend line and 50 / 200daySMA support until we can break out above the 100daySMA @ .038
My fear a move to test .03 late this week by a death cross of the 50daySMA through the 200daySMA was avoided as the uptrend proved to be stronger support than anticipated. As always, some positive news here would be appropriate to keep key technicals intact.
Sector Analysis:
As we saw today, the sector has taken the next leg up as predicted. Here is my hypothesis of this price movement: As we know, no publicly traded company in the sector is profitable as they all have accumulated deficits. That begs the question, why are they all continuing to increase in PPS?
The answer IMO is that political risk has been decreasing as legalization/decriminalization grows nearer and near, thus the increase in value/demand of these MJ stocks exposed to these catalysts.
In 4 months, Nevada will be on ballot for legalization of recreational use. MCIG WILL go parabolic if accepted as its main position and market is in Nevada. Fundamentals go out the window when a catalyst like that occurs ex. Green Rush/MJ Bubble of 2014. It's psychological and MCIG is positioned and correlated enough to the marijuana industry to be associated with these catalysts. Furthermore, to support this thesis/phenomenon, the sector has bottomed (MCIG @ .0187) and currently uptrending! MCIG is 87% correlated to the sector (TRT*, GRN*,MJN*, HEM*). The sector has all bounced significantly from their higher lows put in anywhere from May-June. This political risk currently factored into the PPS of the sector will be greatly reduced once any of the 6 states legalize and more move to MMJ in November. The initial run up that is occurring is also very similar to 2013.
Ultimately, .05 strong price level resistance for MCIG will not hold down a legalization marijuana catalyst buying frenzy.
Fundamental Analysis:
I am bullish on financials and fundamentals as financial risk (bankruptcy) is decreasing with reduced expenses and accumulated deficit, as well as a strong net working capital balance sheet and positive cash flows. With this current financial condition trend, retained earnings/profitability will occur in the 2017 fiscal year
.
MCIG has cleaned up its business model over the long-term to satisfy a sustainable growth valuation via construction/CBD/vapolution/Vitacig/Rollies,LLC revenue. Furthermore, MCIG is debt free and has acquired equity funding to finance operations via a 10% stake in VTCQ Malecon. This stake can not only finance operations, but can be a valuable strategic/diversified gain on investment for the books. This deal came with the acquisition and return of VitaCig assets and revenue that will be on the books for Q12017.
Q42016 financials hopefully will be out on time July 29th, as they stated in the CC that they will be punctual with financials going forward. I think that alone could cause an increase in PPS post-financials.
I'm looking for an increase in profit margin, reduced expenses, more cash on hand, and a progress toward retained earnings by reducing the current accumulated deficit. IMO I think the decrease in revenue over last quarter has already been priced in as that is not new knowledge to hit the market and was explained via the setback section of the CC and the fiscal year results.
I’m long! I managed to average my stake down at the grey ovals at the chart at .028/.029/.032 to a .0302 average from initial .0375 entry on 3/24 uptrend test. I always stress that importance of position size and the ability to average down especially with long term OTC trades. I hope you have all noted how a break of some of these technicals can lead to massive price movement.
GLTA and I am confident we will be well rewarded here in the long term and in November!
@cashbyerstrades
Bantec Reports an Over 50 Percent Increase in Sales and Profits in Q1 2024 from Q1 2023 • BANT • Apr 25, 2024 10:00 AM
Cannabix's Breath Logix Alcohol Device Delivers Positive Impact to Private Monitoring Agency in Montana, USA • BLO • Apr 25, 2024 8:52 AM
Kona Gold Beverages, Inc. Announces Name Change to NuVibe, Inc. and Initiation of Ticker Symbol Application Process • KGKG • Apr 25, 2024 8:30 AM
Axis Technologies Group and Carbonis Forge Ahead with New Digital Carbon Credit Technology • AXTG • Apr 24, 2024 3:00 AM
North Bay Resources Announces Successful Equipment Test at Bishop Gold Mill, Inyo County, California • NBRI • Apr 23, 2024 9:41 AM
Epazz, Inc.: CryObo, Inc. solar Bitcoin operations will issue tokens • EPAZ • Apr 23, 2024 9:20 AM

