


Friday, July 22, 2016 9:11:45 AM
Conventional TA indications of near-term strength are offset by the reducing volume and my unconventional TA. I end up remaining longer-term strongly bullish but near-term bearish until I see a combination of price and volume behavior suggesting we are completing a re-trace (which I expect to begin shortly) and a turn is in the works, all supported by my unconventional stuff, especially the intra-day and EOD short and buy percentages.
There was a PR announcing Capstone’s Russian Distributor Secures Flare Gas Project in the Republic of Uzbekistan.
Considering the positive nature of the PR (the latest in a recently begun series, as I suggested might occur), one might get despondent about the following. But don't - it's just the normal when the investor base is completely disillusioned and apathetic and cautious due to the myriad past failure to materialize of DJ's pronouncements of the great future to come.
Trust, once lost, is hard to regain and it will take time (not to mention actually executing such that he's delivering a forecast that later appears in reality).
A relatively low open dropped a bit lower through 9:43, recovered back to $1.47/8 and went flat there through ~10:30, popped up to $1.50 at 10:41 and managed to hold near there for 21 minutes before beginning a long, slow, flat and down move to $1.46 again at 11:42. Then flat $1.47/8 through ~13:00 and pop up to $1.47/9 at 13:07 to go flat $1.48/9 through 14:52. The the spread widened but we ultimately ended at the bottom of the prior flat range.
All this on low volume, of course.
The day began immediately validating yesterday's top summary including { ... but my unconventional stuff is less sanguine and suggest no near-term strength is likely. }. Maximum buy percentage was 10:45's 47.6% and it was all downhill from there, getting to 32.23% by 13:00 before even appearing to begin a struggle back up. This was all on very low volume (~231.8K through 13:00) that at least gave some shred of hope as it matched a comment further down in yesterday's post: { Given that, I suspect we'll try to break above the new resistance again. I would not expect to get through it tomorrow though - I think we need to see continued reducing volume on sort of stable, but maybe gently weakening(?), price and then rising volume as we challenge again. Unusually for CPST, I don't think this will take as long as usual. }
Well, we did open below and went immediately above the new descending resistance, but came right back to trade on it and 1 penny above (approximate on both scores). And volume was reduced. Any time it behaves as expected I get some hope going, probably inappropriately so.
There was one pre-market 1,500 buy for $1.48, likely due to the PR.
09:30-10:28 opened the day with a 2,426 unknown $1.47 and at 9:33 b/a was 10K:26.8K $1.47/9 and was followed by 9:34's 16.2K $1.47. At 9:38 b/a was 4.8K:28.2K $1.46/9 and 9:35-40's no-trades was followed by 9:41-:43's 6.6K $1.47->$1.4750->$1.46 and at 9:46 b/a was 2.2K:300 $1.46/7. Then came 9:46-48's 2K $1.46 (200)->$1.47 and at 9:52 b/a was 2.3K:2K $1.46/8. Then 9:50's 2K $1.47/$1.4770 and 9:54's 100 $1.47 saw b/a at 9:57 of 5.5K:300 $1.47/8 and we entered a long period of very low/no-volume $1.47/8. At 10:16 b/a was ~1.4K:2.6K $1.47/8. 10:28's 372 $1.4750/48 ended the period.
10:29-10:41, after two no-trades minutes, began a rise with short period of low/medium-volume $1.48/9 through 10:34, low/no-volume through 10:40, and ended the period when it peaked on 10:41's ~37.7K $1.49->$1.48->$1.50.
10:42-11:00 began a few minutes of low/medium-volume $1.49/50 after 10:42-44's ~13.9K $1.49/50 and at 10:47 b/a was ~10.8K:7.7K $1.49/50. 11:00's 3,951 $1.49 ended the period.
11:01-11:38 began very low/no-volume $1.4850/$1.49 through 11:14 on 11:01-:03's ~24.4K $1.49->$1.50->$1.49->$1.48. B/a at 11:03 was 6.6K:1.1K $1.48/9. Then very low/no-volume $1.48/$1.4850 began and b/a at 11:38 was 5.7K:3.5K $1.48/9. 11:38's 6.4K $1.48/9 ended the period.
11:39-12:57, after four no-trades minutes, began very low/no-volume $1.47/8 on 11:42's $1.48->$1.47->$1.4601->$1.48 (looked like a market sell order?) and at 11:45 b/a was 6.1K:900 $1.47/8, 11:56 2.9K:2.4K $1.47/8, 12:26 3K:1.9K $1.47/8. 12:57's 150 $1.475 ended the period.
12:58-14:46, after ten no-trades minutes, began very low/no-volume $1.48/9 on 13:07's ~12.3K 1.48->$1.4750/$1.48->$1,49->$1.47->$1.47->$1.49->$1.48. It tightened up to $1.4850/9 later in the period (~13:18). At 13:30 b/a was 6.5K:4.5K $1.48/9, 13:43 7.7K:5.7K $1.48/9, 14:03 5.2K:5.3K $1.48/9, 14:18 5.3K:6.4K $1.48/9. Spread open again to $1.48/9 at 14:30. 14:34 5.9K:4.5K $1.48/9. 14:46's 600 $1.49 ended the period.
14:47-14:54, after five no-trades minutes, did 14:53-:54's ~69.9K $1.4895->$1.48->$1.49->$1.48/9->$1.4850/$1.49->$1.49->$1.50->$1.49/50 to end the period.
14:55-15:12 dropped back to start doing very low/no-volume $1.48/9 again on 14:55's ~2.4K $1.50. At 15:16 b/a was 3K:2.7K $1.48/9. 15:12's 100 $1.4899 ended the period.
15:13-16:00, after seven no-trade minutes, began low-volume $1.49/50 on 15:20's 3.6K $1.48->$1.50->$1.49. At 15:42 b/a was 1.5K:2.7K $1.49/50 and 15:42 did 5.1K $1.49/50 that moved trading to flat $1.49, with b/a at 4.6K:2.5K $1.48/9, until 15:50 began $1.4850/$1.49 and b/a went 5.1K:1.6K $1.48/9. At 15:58 range moved to $1.49/50 and ended the period and day on 15:59's 864 $1.49->$1.50->$1.49 and 16:00's 493 sell for $1.48.
There were no AH trades.
Excluding the opening and closing trades (didn't qualify), there were 10 larger trades (>=5K & 3 4K+) totaling 62,175, 15.83% of day's volume, with a $1.4843 VWAP. The number of larger trades is fairly normal but the percentage of day's volume is on the light side, likely because we again had no "larger larger trades". This is not a sign of strength, especially considering the positive PR today.
On the traditional TA front, movements were:Ending Period Period Period __Per. Trade_ Period_ % Day_ Per. End
Period Volume Low High _Dollar Val._ VWAP___ Volume Buy ~%
10:28 57021 $1.4600 $1.4800 $83,984.35 $1.4729 14.52% 35.30% Incl 09:34 $1.4700 6,200 6,200
10:41 59322 $1.4750 $1.5000 $88,283.40 $1.4882 15.11% 43.73% Incl 10:41 $1.4900 11,683
11:00 43410 $1.4900 $1.5000 $64,844.93 $1.4938 11.05% 40.39%
11:38 37499 $1.4800 $1.5000 $55,801.52 $1.4881 9.55% 36.58% Incl 11:01 $1.4900 7,200 11:38 $1.4850 4,300
12:57 32942 $1.4601 $1.4800 $48,551.60 $1.4739 8.39% 32.23% Incl 12:18 $1.4730 5,000
14:46 49705 $1.4700 $1.4900 $73,791.00 $1.4846 12.66% 34.88% Incl 13:07 $1.4800 6,700
14:54 69474 $1.4800 $1.5000 $103,871.17 $1.4951 17.69% 37.23% Incl 14:53 $1.4895 4,100 14:54 $1.5000 6,692
15:12 6902 $1.4801 $1.5000 $10,300.35 $1.4924 1.76% 40.85%
16:00 32055 $1.4800 $1.5000 $47,739.80 $1.4893 8.16% 40.67% Incl 15:42 $1.4900 4,100
In line with my feeling yesterday of no near-term strength, we have a lower open, high and volume with only a flat low and marginally higher close.__Open_ ___Low_ __High_ _Close_ Volume_
Today -0.68% 0.00% -1.32% 1.37% -34.95%
Prior 8.82% 7.35% 2.70% 0.69% -41.98%
On my minimal chart, as mentioned above, we had a lower open, high and volume with a flat low and higher close. We opened right on and closed above the new descending resistance. Recall it drops about 1/2 penny/day. Even with that in mind I'm thinking, with what's seen today, that we will not close above it tomorrow, thereby not confirming a breakout.
Price continues "pushing" the experimental 13-period Bollinger upper limit for the third day. Yesterday I noted { ... seem to get 3-4 days of this behavior and begin a re-trace on the third or fourth day. However, the history I can see with any detail with occurrences are not long enough to assign a high degree of confidence. } Aside from the mangling of tense (I can tell I really rushed yesterday), this looks like it will play out as we have the earliest suggestions of weakness.
I also said { Given that, I suspect we'll try to break above the new resistance again. I would not expect to get through it tomorrow though - I think we need to see continued reducing volume on sort of stable, but maybe gently weakening(?), price and then rising volume as we challenge again. Unusually for CPST, I don't think this will take as long as usual. }
We did try and we did get through though as we closed above the line. Another close above converts the line to potential support.
Adding the reducing volume to the above, I suspect our best near-term outcome, based only on what's on the minimal chart, is we ride that new medium-term descending trend line lower for a little bit. This changes if we see the stability or mild weakening and volume behavior I repeated above.
My one-year chart, which had the second consecutive day of the 10, 20 and 50-day SMAs rising yesterday, makes it three in a row, but just barely as the 50-day squeaked out a $0.0004 rise. Maybe we should call it flat because our trading range held and that way I could be right?
 Anyway, if we hold the current close, not expected of course, the 10 and 20-day SMAs will continue to rise 10 and 19 days respectively. The 50-day will drop one day and them resume a slow rise for 6 days.
 The oscillators I watch, which yesterday had good improvement in everything but Williams %R, had weakening only in MFI (untrusted by me) and ADX-related, and had accumulation/distribution absolutely flat. Everything but accumulation/distribution are above neutral and Williams %R squeaked back into overbought.
The 13-period Bollinger limits, $1.2836 and $1.4779 ($1.2948 and $1.4545 yesterday), continue diverging and raising the mid-point.
All in, I think we are at least taking a short breather from a two-day PR-inspired (I guess) rise. What I know is that these higher closes have occurred on two days of reducing volume now, indicating lack of strength. Based on that my "not at least" scenario includes a re-trace to the low $1.40 level.
Percentages for daily short sales and buys moved in opposite directions, bad, and the short percentage is excessively low. The buy percentage is below even the low that's "normal" for CPST and the intra-day behavior was even worse than this indicates, weakening all through the day from 10:45's peak 47.6% to 13:00 32.2% before trying to mount any move upward. It hit only ~37.2% at 14:54 and then moved to mid-40% range for the rest of the day.
This combination suggests either short-term long MMs were selling or there was a lot of inter/intra-broker selling by broker customers. Since broker customer shares are held in the brokers' names the selling tends to generate fewer short-sale flags as many of the trades would occur within the brokers' accounts.
The spread compressed, as would be expected if we were topping and getting ready to either roll over or shoot higher after taking a breather. From what I see here the former looks most likely.
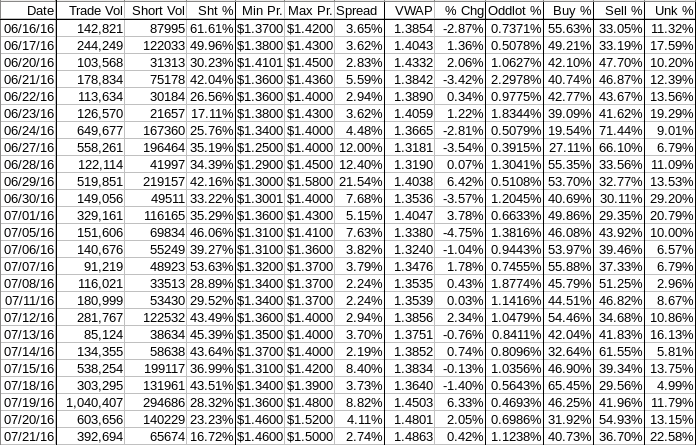
The VWAP's last twenty-four readings improved, now at 9 negatives and 15 positives. Change since 06/16 is $0.1009, 7.28%, and the averages of the rolling 24-day period seen in the last few days (latest first) are 0.3316%, 0.195%, ~0.127%, 0.0091%, and -0.0047%.
All in, there's no suggestion of near-term strength here. The VWAP changes of a longer period are moving more positively though and that leaves me still more strongly bullish even though near-term bearish.
As always, much is experimental and should be treated as such.
Bill
Join the InvestorsHub Community
Register for free to join our community of investors and share your ideas. You will also get access to streaming quotes, interactive charts, trades, portfolio, live options flow and more tools.

