


Thursday, July 21, 2016 10:14:38 PM
conix -- an inane, meaningless cherry-pick of an old article which wasn't even consistent with the scientific consensus at the time and has long since been rendered ever more thoroughly utterly irrelevant at best by subsequent data and science
further to the other replies to your post, in particular (linked in) http://investorshub.advfn.com/boards/read_msg.aspx?message_id=124035425 and following, and http://investorshub.advfn.com/boards/read_msg.aspx?message_id=124037888 and preceding (and any future following):
to have it here, here's that article, again itself cherry-picked from the science that had been done at the time, in full:
*
International Team of Specialists Finds No End in Sight to 30-Year Cooling Trend in Northern Hemisphere

January 5, 1978, Page 17
The New York Times Archives
caption and credit for the picture center-right:
The James E. Snyder smashing through the ice-clogged Mississippi River near Keokuk, Iowa, to make way for grain barges caught upstream by the early cold weather. Lock No. 19, on river at Keokuk, closed Tuesday.
Associated Press
By WALTER SULLIVAN
JAN. 5, 1978
An international team of specialists has concluded from eight indexes of climate that there is no end in sight to the cooling trend of the last 30 years, at least in the Northern Hemisphere.
In some, but not all cases, the data extend through last winter. They include sea surface temperatures in the northcentral Pacific and north Atlantic, air temperatures at the surface and at various elevations as well as the extent of snow and ice cover at different seasons.
In almost all cases it has been found that the year-to-year variations in climate are far more marked than the long-term trend. The long-term trend often becomes evident only when data from a number of years are displayed.
The report, prepared by German, Japanese and American specialists, appears in the Dec. 15 issue of Nature, the British journal. The findings indicate that from 1950 to 1975 the cooling, per decade, of most climate indexes in the Northern Hemisphere was from 0.1 to 0.2 degrees Celsius, roughly 0.2 to 0.4 degrees Fahrenheit.
Data from the Southern Hemisphere, particularly south of latitude 30 south, are so meager that reliable conclusions are not possible, the report says. The 30th parallel of south latitude passes through South Africa, Chile and southern Australia. The cooling trend seems to-extend at least part way into the Southern Hemisphere but there have been indications of warming at high southern latitudes.
The various indexes were reported as follows:
¶Average surface air temperatures recorded at 358 stations north of latitude 20 degrees south from 1951 to 1975 have been analyzed by Drs. R. Yamamoto and T. Iwashima of Kyoto University in Japan on regional and season bases. A general cooling is evident with “an intensive cooling episode” from 1961 to 1964.
¶Generally similar trends are evident in temperatures of the lower 18,000 feet of the atmosphere as charted by Dr. Horst Dronia of the Weather Office in Hannover, West Germany. For the period from 1949 to 1976, he has calculated, for 220 points in the Northern Hemisphere, the average temperature of the atmosphere from the separation between the pressure levels near the surface (at 1,000 millibars) and one high up (at 500 millibars). An increase in separation indicated expansion and hence warming. A decrease, for example, of 20 meters (66 feet) was taken to mean atmospheric shrinking, indicating a cooling in that case of I degree Celsius (almost 2 degrees Fahrenheit).
¶Observations extending higher into the atmosphere confirmed the trend. The authors were Drs. J. K. Angell and. 1. Korshover of the National Oceanic and Atmospheric Administration Laboratories. in Silver Spring, Md.
¶North Pacific water temperatures compiled by the same agency's Marine Fisheries Service have been analyzed by Dr. Jerome Namias of the Scripps Institution of Oceanography at La Jolla, Calif. The original source was temperature readings of cooling water intake made by ships at a rate of more than 20,000 a month. The data, plotted for 153 locations, show a gradual cooling broken by a sharp warming in 1967-68.
¶A similar study based on data from weather ships in the North Atlantic has been done by Dr. Martin Rodewald, former head of the Oceanic Division of the German Weather Service. Since the seven American weather ships were withdrawn in 1973 only two have remained, but observations of a cooling trend have continued.
¶A gradual increase in area of the northern circumpolar vortex, the massive flow of frigid air around the Arctic, has been recorded by Drs. Angell and Korshover. In 1976 its southern’ extent was the greatest in 10 years and last winter it was 1 percent larger than in any previous winter observed.
¶Snow and ice cover in the Northern Hemisphere have varied greatly but there has been a net increase according to a satellite photograph analysis by Dr George J. Kukla of Columbia University's Lamont-Doherty Geological Observatory. This has been most marked in the spring when so highly reflective a cover returns much solar energy into space at a time of intense solar radiation.
¶Antarctic sea ice coverage, after increasing to 1972, has been shrinking.
The observations come, at a time when a warming trend could have been expected from the increase of carbon dioxide in the atmosphere due to extensive fuel burning. The gas inhibits the escape of solar heat from the earth. Dr. Kukla, in a telephone interview this week, said that the cause of the apparent cooling remained unknown and that no scientific attempt to predict whether the trend would continue was possible. Monitoring of the various indexes is continuing, he added.
© 1978 The New York Times Company
http://www.nytimes.com/1978/01/05/archives/international-team-of-specialists-finds-no-end-in-sight-to-30year.html
*
and the referenced Nature study:
New data on climatic trends
Nature 270, 573-580 (15 December 1977) | doi:10.1038/270573a0; Accepted 13 October 1977
G. J. Kukla*, J. K. Angell†, J. Korshover†, H. Dronia‡, M. Hoshiai§, J. Namiasparallel, M. Rodewald¶, R. Yamamoto$ & T. Iwashima$
Indicators of large-scale climate developments show that the oscillatory cooling observed in the past 30 yr in the Northern Hemisphere has not yet reversed. This conclusion was reached by updating our data on the month-to-month, season-to-season, and year-to-year variations of selected zonally averaged meteorological parameters.
http://www.nature.com/nature/journal/v270/n5638/pdf/270573a0.pdf , http://www.nature.com/nature/journal/v270/n5638/abs/270573a0.html
*
now back to (more of) the reality, of the data and the science:
How the "Global Cooling" Story Came to Be
Nine paragraphs written for Newsweek in 1975 continue to trump 40 years of climate science. It is a record that has its author amazed.
January 10, 2014
http://www.scientificamerican.com/article/how-the-global-cooling-story-came-to-be/ [with comments]
Climate Denial Crock of the Week
The 1970s Ice Age Myth and Time Magazine Covers
https://climatecrocks.com/2013/06/07/the-1970s-ice-age-myth-and-time-magazine-covers-by-david-kirtley/ [with comments], http://www.youtube.com/watch?v=XB3S0fnOr0M [embedded; with comments]
That ’70s myth—did climate science really call for a “coming ice age?”

Claims that scientists flip-flopped on climate don't reflect the science.
6/7/2016
http://arstechnica.com/science/2016/06/that-70s-myth-did-climate-science-really-call-for-a-coming-ice-age/ [with comments]
Cruz on the Global Cooling Myth and Galileo
March 27, 2015
http://www.factcheck.org/2015/03/cruz-on-the-global-cooling-myth-and-galileo/
Huckabee’s claim that ‘global freezing’ theories from the 1970s shows the science is ‘not as settled’ on climate change
“Whether it’s man-made or not, I know that when I was in college I was being taught that if we didn’t act very quickly, that we were going to be entering a global freezing. And, you know, go back and look at the covers of Time and Newsweek from the early ’70s. And we were told that if we didn’t do something by 1980, we’d be popsicles. Now we’re told that we’re all burning up. Science is not as settled on that as it is on some things.”
— Former Arkansas governor Mike Huckabee (R), on NBC’s “Meet the Press,” June 21, 2015

June 25, 2015
https://www.washingtonpost.com/news/fact-checker/wp/2015/06/25/huckabees-claim-that-global-freezing-theories-from-the-1970s-shows-the-science-is-not-as-settled-on-climate-change/ [WITH COMMENTS]
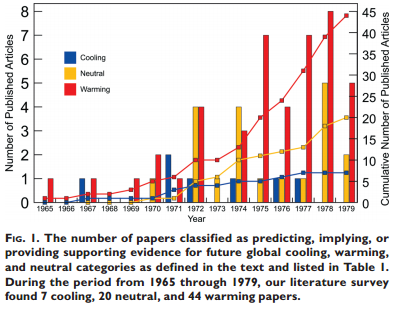
THE MYTH OF THE 1970s GLOBAL COOLING SCIENTIFIC CONSENSUS
There was no scientific consensus in the 1970s that the Earth was headed into an imminent ice age. Indeed, the possibility of anthropogenic warming dominated the peer-reviewed literature even then.
September 2008
http://journals.ametsoc.org/doi/pdf/10.1175/2008BAMS2370.1
Reality Check: Most Scientists Never Believed In "Global Cooling"

http://io9.gizmodo.com/reality-check-most-scientists-never-believed-in-globa-1617925806 [with comments], http://www.youtube.com/watch?v=FM_k4koWMm8 [embedded; with comments]
my own (with others) ongoing primary string on the subject:
(linked in) http://investorshub.advfn.com/boards/read_msg.aspx?message_id=102161216 (in particular but without limitation the included "40 years of science destroyed by one old magazine article"

[ http://www.dailyclimate.org/tdc-newsroom/2014/01/Newsweek%20cooling.jpg , http://www.dailykos.com/story/2014/04/30/1295885/-40-years-of-science-destroyed-by-one-old-magazine-article ]) and preceding and following,

[ http://www.nasa.gov/feature/goddard/2016/climate-trends-continue-to-break-records ]
http://investorshub.advfn.com/boards/read_msg.aspx?message_id=124017756 and preceding and following
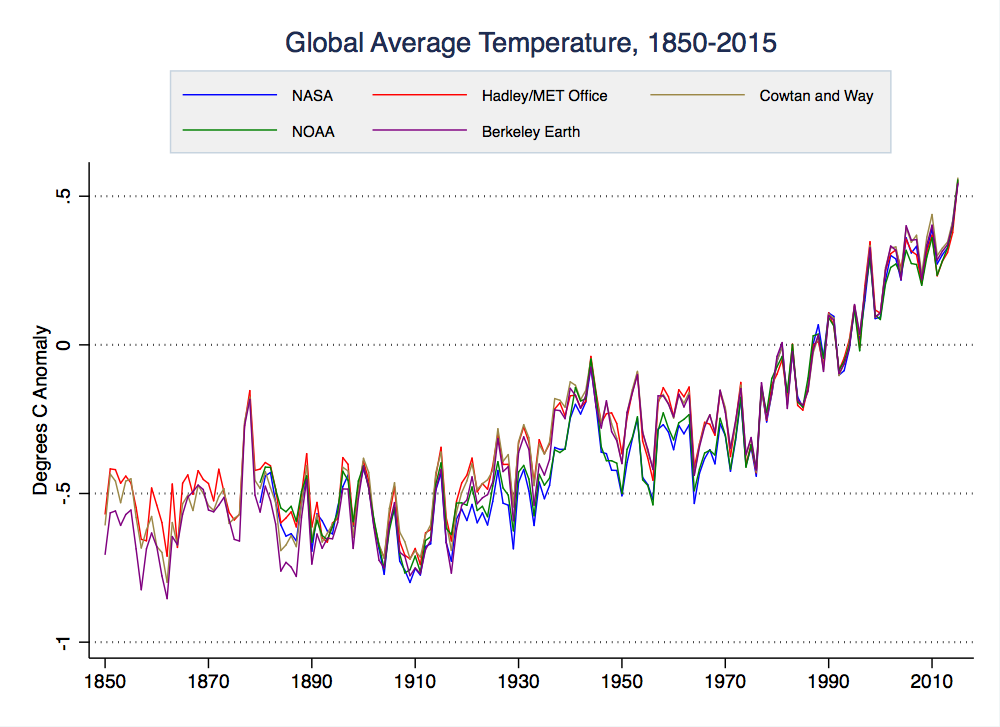
GISS Surface Temperature Analysis

Land-ocean temperature index, 1880 to present, with base period 1951-1980. The solid black line is the global annual mean and the solid red line is the five-year lowess smooth. The blue uncertainty bars (95% confidence limit) account only for incomplete spatial sampling. [This is an update of Fig. 9a in Hansen et al. (2010) ( http://pubs.giss.nasa.gov/abs/ha00510u.html ).]

As in the original analysis, here only meteorological station data were used to estimate the global annual-mean surface air temperature deviation from the 1951-1980 mean. [This is an update of Plate 6(b) in Hansen et al. (2001) ( http://pubs.giss.nasa.gov/abs/ha01300a.html {link apparently gone dark}).]
http://data.giss.nasa.gov/gistemp/graphs/
further to the other replies to your post, in particular (linked in) http://investorshub.advfn.com/boards/read_msg.aspx?message_id=124035425 and following, and http://investorshub.advfn.com/boards/read_msg.aspx?message_id=124037888 and preceding (and any future following):
to have it here, here's that article, again itself cherry-picked from the science that had been done at the time, in full:
*
International Team of Specialists Finds No End in Sight to 30-Year Cooling Trend in Northern Hemisphere

January 5, 1978, Page 17
The New York Times Archives
caption and credit for the picture center-right:
The James E. Snyder smashing through the ice-clogged Mississippi River near Keokuk, Iowa, to make way for grain barges caught upstream by the early cold weather. Lock No. 19, on river at Keokuk, closed Tuesday.
Associated Press
By WALTER SULLIVAN
JAN. 5, 1978
An international team of specialists has concluded from eight indexes of climate that there is no end in sight to the cooling trend of the last 30 years, at least in the Northern Hemisphere.
In some, but not all cases, the data extend through last winter. They include sea surface temperatures in the northcentral Pacific and north Atlantic, air temperatures at the surface and at various elevations as well as the extent of snow and ice cover at different seasons.
In almost all cases it has been found that the year-to-year variations in climate are far more marked than the long-term trend. The long-term trend often becomes evident only when data from a number of years are displayed.
The report, prepared by German, Japanese and American specialists, appears in the Dec. 15 issue of Nature, the British journal. The findings indicate that from 1950 to 1975 the cooling, per decade, of most climate indexes in the Northern Hemisphere was from 0.1 to 0.2 degrees Celsius, roughly 0.2 to 0.4 degrees Fahrenheit.
Data from the Southern Hemisphere, particularly south of latitude 30 south, are so meager that reliable conclusions are not possible, the report says. The 30th parallel of south latitude passes through South Africa, Chile and southern Australia. The cooling trend seems to-extend at least part way into the Southern Hemisphere but there have been indications of warming at high southern latitudes.
The various indexes were reported as follows:
¶Average surface air temperatures recorded at 358 stations north of latitude 20 degrees south from 1951 to 1975 have been analyzed by Drs. R. Yamamoto and T. Iwashima of Kyoto University in Japan on regional and season bases. A general cooling is evident with “an intensive cooling episode” from 1961 to 1964.
¶Generally similar trends are evident in temperatures of the lower 18,000 feet of the atmosphere as charted by Dr. Horst Dronia of the Weather Office in Hannover, West Germany. For the period from 1949 to 1976, he has calculated, for 220 points in the Northern Hemisphere, the average temperature of the atmosphere from the separation between the pressure levels near the surface (at 1,000 millibars) and one high up (at 500 millibars). An increase in separation indicated expansion and hence warming. A decrease, for example, of 20 meters (66 feet) was taken to mean atmospheric shrinking, indicating a cooling in that case of I degree Celsius (almost 2 degrees Fahrenheit).
¶Observations extending higher into the atmosphere confirmed the trend. The authors were Drs. J. K. Angell and. 1. Korshover of the National Oceanic and Atmospheric Administration Laboratories. in Silver Spring, Md.
¶North Pacific water temperatures compiled by the same agency's Marine Fisheries Service have been analyzed by Dr. Jerome Namias of the Scripps Institution of Oceanography at La Jolla, Calif. The original source was temperature readings of cooling water intake made by ships at a rate of more than 20,000 a month. The data, plotted for 153 locations, show a gradual cooling broken by a sharp warming in 1967-68.
¶A similar study based on data from weather ships in the North Atlantic has been done by Dr. Martin Rodewald, former head of the Oceanic Division of the German Weather Service. Since the seven American weather ships were withdrawn in 1973 only two have remained, but observations of a cooling trend have continued.
¶A gradual increase in area of the northern circumpolar vortex, the massive flow of frigid air around the Arctic, has been recorded by Drs. Angell and Korshover. In 1976 its southern’ extent was the greatest in 10 years and last winter it was 1 percent larger than in any previous winter observed.
¶Snow and ice cover in the Northern Hemisphere have varied greatly but there has been a net increase according to a satellite photograph analysis by Dr George J. Kukla of Columbia University's Lamont-Doherty Geological Observatory. This has been most marked in the spring when so highly reflective a cover returns much solar energy into space at a time of intense solar radiation.
¶Antarctic sea ice coverage, after increasing to 1972, has been shrinking.
The observations come, at a time when a warming trend could have been expected from the increase of carbon dioxide in the atmosphere due to extensive fuel burning. The gas inhibits the escape of solar heat from the earth. Dr. Kukla, in a telephone interview this week, said that the cause of the apparent cooling remained unknown and that no scientific attempt to predict whether the trend would continue was possible. Monitoring of the various indexes is continuing, he added.
© 1978 The New York Times Company
http://www.nytimes.com/1978/01/05/archives/international-team-of-specialists-finds-no-end-in-sight-to-30year.html
*
and the referenced Nature study:
New data on climatic trends
Nature 270, 573-580 (15 December 1977) | doi:10.1038/270573a0; Accepted 13 October 1977
G. J. Kukla*, J. K. Angell†, J. Korshover†, H. Dronia‡, M. Hoshiai§, J. Namiasparallel, M. Rodewald¶, R. Yamamoto$ & T. Iwashima$
Indicators of large-scale climate developments show that the oscillatory cooling observed in the past 30 yr in the Northern Hemisphere has not yet reversed. This conclusion was reached by updating our data on the month-to-month, season-to-season, and year-to-year variations of selected zonally averaged meteorological parameters.
http://www.nature.com/nature/journal/v270/n5638/pdf/270573a0.pdf , http://www.nature.com/nature/journal/v270/n5638/abs/270573a0.html
*
now back to (more of) the reality, of the data and the science:
How the "Global Cooling" Story Came to Be
Nine paragraphs written for Newsweek in 1975 continue to trump 40 years of climate science. It is a record that has its author amazed.
January 10, 2014
http://www.scientificamerican.com/article/how-the-global-cooling-story-came-to-be/ [with comments]
Climate Denial Crock of the Week
The 1970s Ice Age Myth and Time Magazine Covers
June 7, 2013
https://climatecrocks.com/2013/06/07/the-1970s-ice-age-myth-and-time-magazine-covers-by-david-kirtley/ [with comments], http://www.youtube.com/watch?v=XB3S0fnOr0M [embedded; with comments]
That ’70s myth—did climate science really call for a “coming ice age?”


Claims that scientists flip-flopped on climate don't reflect the science.
6/7/2016
http://arstechnica.com/science/2016/06/that-70s-myth-did-climate-science-really-call-for-a-coming-ice-age/ [with comments]
Cruz on the Global Cooling Myth and Galileo

March 27, 2015
http://www.factcheck.org/2015/03/cruz-on-the-global-cooling-myth-and-galileo/
Huckabee’s claim that ‘global freezing’ theories from the 1970s shows the science is ‘not as settled’ on climate change

“Whether it’s man-made or not, I know that when I was in college I was being taught that if we didn’t act very quickly, that we were going to be entering a global freezing. And, you know, go back and look at the covers of Time and Newsweek from the early ’70s. And we were told that if we didn’t do something by 1980, we’d be popsicles. Now we’re told that we’re all burning up. Science is not as settled on that as it is on some things.”
— Former Arkansas governor Mike Huckabee (R), on NBC’s “Meet the Press,” June 21, 2015

June 25, 2015
https://www.washingtonpost.com/news/fact-checker/wp/2015/06/25/huckabees-claim-that-global-freezing-theories-from-the-1970s-shows-the-science-is-not-as-settled-on-climate-change/ [WITH COMMENTS]
THE MYTH OF THE 1970s GLOBAL COOLING SCIENTIFIC CONSENSUS
There was no scientific consensus in the 1970s that the Earth was headed into an imminent ice age. Indeed, the possibility of anthropogenic warming dominated the peer-reviewed literature even then.
September 2008
http://journals.ametsoc.org/doi/pdf/10.1175/2008BAMS2370.1
Reality Check: Most Scientists Never Believed In "Global Cooling"

8/08/14
http://io9.gizmodo.com/reality-check-most-scientists-never-believed-in-globa-1617925806 [with comments], http://www.youtube.com/watch?v=FM_k4koWMm8 [embedded; with comments]
my own (with others) ongoing primary string on the subject:
(linked in) http://investorshub.advfn.com/boards/read_msg.aspx?message_id=102161216 (in particular but without limitation the included "40 years of science destroyed by one old magazine article"

[ http://www.dailyclimate.org/tdc-newsroom/2014/01/Newsweek%20cooling.jpg , http://www.dailykos.com/story/2014/04/30/1295885/-40-years-of-science-destroyed-by-one-old-magazine-article ]) and preceding and following,

[ http://www.nasa.gov/feature/goddard/2016/climate-trends-continue-to-break-records ]
http://investorshub.advfn.com/boards/read_msg.aspx?message_id=124017756 and preceding and following
GISS Surface Temperature Analysis

Land-ocean temperature index, 1880 to present, with base period 1951-1980. The solid black line is the global annual mean and the solid red line is the five-year lowess smooth. The blue uncertainty bars (95% confidence limit) account only for incomplete spatial sampling. [This is an update of Fig. 9a in Hansen et al. (2010) ( http://pubs.giss.nasa.gov/abs/ha00510u.html ).]

As in the original analysis, here only meteorological station data were used to estimate the global annual-mean surface air temperature deviation from the 1951-1980 mean. [This is an update of Plate 6(b) in Hansen et al. (2001) ( http://pubs.giss.nasa.gov/abs/ha01300a.html {link apparently gone dark}).]
http://data.giss.nasa.gov/gistemp/graphs/
Greensburg, KS - 5/4/07
"Eternal vigilance is the price of Liberty."
from John Philpot Curran, Speech
upon the Right of Election, 1790
F6
Join the InvestorsHub Community
Register for free to join our community of investors and share your ideas. You will also get access to streaming quotes, interactive charts, trades, portfolio, live options flow and more tools.

