


Sunday, July 17, 2016 11:22:16 AM
In aggregate, I'm thinking after an early low Monday we'll see behavior consistent with "consolidation" and possibly the return of "mildly bullish bias".
Pay close attention to the comments below about the suspicious AH trade. What's suggested there is not assured but it has come to fruition a very high percentage of the times that I've seen such.
Another typical open $1.38 and early drop to $1.3601 by 9:44 and then bounce 'em on up to $1.39 by 9:51. All on low volume of course. Then sink back down by 10:30 to begin generally very low/no-volume $1.37/8 through 11:57.
Then came an aberration as we saw a high-volume (~28% of day's volume) push to $1.42 in the six minutes ending at 12:03 and a fall back to the prior range (check VWAPs for periods) beginning at ~12:08 on an aggregate ~19% of day's volume. This up and down is also where a very large majority of the larger trades occurred but they were all "smaller larger trades".
The last significant move, lower, occurred in the 13:24 two-minute period on ~11% of day's volume and VWAP held pretty steady.
The buy percentage acted as one would expect, peaking at 12:03 and falling through ~14:45 before flattening somewhat.
There were no pre-market trades.
09:30-10:20 opened the day with a 4,128 buy for $1.38, did 9:34's 1K $1.3678, 9:35's 600 $1.38 and 9:35 b/a was 1.8K:559 $1.36/8. 9:38's 2.5K $1.3722 left b/a at 9:39 at 1.7K:559 $1.36/8. Then came 9:44's 1.1K $1.3601 (1K)/$1.38 (100), 9:45's ~1.7K $1.38 and 9:49 had b/a of 1.9K:2.8K $1.37/9. Then came 9:51's~1.2K $1.39, 9:52's 1.9K $1.39, 9:54's 343 $1.38. 9:55-10:12's no trades saw b/a at 10:00 3.5K:3.3K $1.38/9, 10:05 2.8K:3.5K $1.38/9. 10:13's 2.7K $1.3850 and 10:15's 600 $1.3850 led to 10:17's b/a 2.5K:6.5K $1.38/9. The period ended on 10:20's 2.6K $1.38/$1.3802.
10:21-11:58, after nine no-trades minutes, began a lower range very low/no-volume $1.37/8 on 10:30's ~4.2K $1.3850->$1.38->$1.37. At 10:32 b/a was 1.3K:2.4K $1.37/8. Then came 10:39's 257 $1.3770, 10:40's 2.6K $1.37/$1.3750, 10:41's 100 $1.38, 10:43's 8.4K $1.38->$1.3799->$1.38->$1.37, 10:44's ~1.6K $1.38->$1.37, 10:47's 100 $1.38 (of course) and left b/a at 3.5K:3.2K $1.37/8. Thereafter, the very low/no-volume became consistent, interrupted by 11:01-03's's 20.5K (3 blks >5K) $1.37/$1.3765 and 11:36's 3.6K $1.3715 (3.5K)/$1.38 (100). B/a at 11:00 was 5.1K:3K $1.37/8, 11:03 2.9K:4.4K $1.37/8, 11:16 2.5K:7.7K $1.37/8, 11:35 3.6K:4.9K $1.37/8, 11:38 4.8K:4.7K $1.37/8. 11:58's ~12.9K $1.37/8 ended the period.
11:59-12:03 did a high-volume "moon shot" on ~150.7K $1.3850->$1.39->$1.39/40->$1.41->$1.40/1->$1.42(1K).
12:04-12:07 reversed about half the prior period's rise on ~57.6K $1.41->$1.4037->$1.41xx->$1.40->$1.40/$1.40xx->$1.39->$1.39/40, ending the period on 12:07's 11.4K $1.39/40. B/a at 12:07 was 9.4K:2.2K $1.39/40.
12:08-12:19 ate the remaining half of the rise on ~65.7K $1.3967->$1.4060->$1.40->$1.3950->$1.39->$1.38->$1.37, ending the period on 12:19's ~11.8K $1.37/8. B/a at 12:12 was 8.1K:1.7K $1.39/40.
12:20-13:22 began a long very low/no-volume $1.37/8 on 12:19's ~11.8K and ended on 13:22's 100 $1.38.
13:23-13:24 did a fast ~58.6K drop $1.37->$1.36/7->$1.36->$1.35/6, ending the period on 13:24's ~33.5K $1.36->$1.37->$1.35->$1.36.
13:25-13:50, after one no-trades minute, began an extremely low/no-volume $1.35/6 on 13:26's 4.3K $1.35/6, ending the period on 13:50's 1.6K $1.3599/$1.36. 13:27 had b/a 2.5K:1.8K $1.35/6.
13:51-14:07, after six no-trades minutes, stepped up and began another extremely low/no-volume $1.36 on 13:57's 100 $1.36 and ended the period on 14:07's 800 $1.36.
14:08-14:49, after two no-trades minutes, again stepped up and began extremely low/no-volume $1.36/7 on 14:10's 300 $1.37 and ended the period on 14:49's 100 $1.36. B/a at 14:10 was 1K:700 $1.36/7.
14:50-15:58 began an extremely low/no-volume $1.35/6 on 14:50's 6.7K $1.36->$1.3670->$1.35 and ended the period on 15:58's 5.9K $1.35/6. B/a at 14:57 was 6.3K:2.9K $1.35/6, 15:33 15.8K:2.1K $1.35/6.
15:59/16:00 began a weak imitation of normal EOD volatility on 15:59's ~14.3K $1.36->$1.35->$1.36->$1.35->$1.36->$1.37->$1.36->$1.35, ending the period and day on 16:00's 1.6K sell for $1.35.
There were two AH trades, one 16:01:28 2K $1.37 and a suspicious one at 16:04:39 of 150 shares for $1.31, well below the day's range and the close of $1.35. In my experience this is a red flag. I think it's someone planting a faux flag that will appear on charts and reporting services' "last trade", maybe trigger stops and lead to early trading lower prices presenting a buying opportunity for one so inclined. I always suspect shorters of doing this so they can cover shorts at a large profit. It could also be MMs who had a large number of shorts and wish to do covering buys to decrease net VWAP cost basis on incoming shares backing customer sell orders that were handled. With today's higher than usual volume I guess this latter scenario could be the situation, especially with the real spread of $1.35-$1.42 seen today, spiking up and then falling back into normal range.
I'll never know. Much more down in the minimal chart discussion.
Excluding the opening and closing trades (didn't qualify), there were 20 larger trades (>=5K & 7 4K+) totaling 113,146, 21.02% of day's volume, with a $1.3789 VWAP. The count and percentage seems fairly normal for our volume. What's absent is any "larger larger trades", suggesting we had few/no "behind the curtain" trades and it's likely some of these were parts of larger trades that had to be handled in "chunks" as the MMs worked harder to complete them during the high-volatility 11:59-12:07 period and, to a lesser degree of volatility, through the 13:24 period. That's only a possibility though and we'll never know.
It does suggest the volume-indicated strength in the down move today is not really all that strong though. This is supported by the minimal decline in the day-over-day VWAP.
Regardless, combined with the facts that ~38% of the larger trades' volume occurred on the way up to the day's high in the 12:03 period, they were "smaller" larger trades, and buy percentage rose and peaked there and began to decline, it does suggest most(?) were retail trades. Contradicting that, maybe is the fact that the VWAP was below the day's $1.3834. But that could be just because these same retail traders locked in profits or cut losses on the way down from the peak. This would suggest predominately day or momo traders but we have no hint of such outside these metrics.
On the traditional TA front, movements were:Ending Period Period Period __Per. Trade_ Period_ % Day_ Per. End
Period Volume Low High _Dollar Val._ VWAP___ Volume Buy ~%
10:20 20160 $1.3601 $1.3900 $27,816.96 $1.3798 3.75% 57.58%
11:58 58233 $1.3700 $1.3850 $80,166.63 $1.3767 10.82% 53.29% Incl 11:01 $1.3740 5,000 11:02 $1.3765 6,000
11:03 $1.3760 7,428
12:03 150128 $1.3850 $1.4200 $209,821.79 $1.3976 27.89% 59.97% Incl 12:00 $1.4000 4,900 4,600
12:00 $1.3950 4,700 12:01 $1.3968 5,000
12:03 $1.4034 5,000
12:07 57594 $1.3900 $1.4199 $80,997.28 $1.4063 10.70% 53.87%
12:19 65850 $1.3700 $1.4060 $91,691.99 $1.3924 12.23% 51.40% Incl 12:12 $1.4017 4,000 12:17 $1.3900 8,000
12:18 $1.3900 5,000 12:19 $1.3804 4,600
13:22 35727 $1.3700 $1.3801 $49,220.16 $1.3777 6.64% 47.92% Incl 12:27 $1.3800 7,200 13:12 $1.3701 7,000
13:24 58592 $1.3500 $1.3701 $79,906.88 $1.3638 10.89% 45.82% Incl 13:23 $1.3700 5,000 13:24 $1.3600 4,000
13:24 $1.3600 8,000
13:50 11900 $1.3500 $1.3600 $16,116.46 $1.3543 2.21% 45.52%
14:07 1200 $1.3600 $1.3600 $1,632.00 $1.3600 0.22% 45.73%
14:49 1405 $1.3600 $1.3700 $1,922.67 $1.3684 0.26% 45.42%
15:58 55900 $1.3500 $1.3670 $75,891.94 $1.3576 10.39% 46.72% Incl 14:51 $1.3600 5,900 15:58 $1.3600 4,000
16:00 15898 $1.3500 $1.3700 $21,587.73 $1.3579 2.95% 46.74% Incl 15:59 $1.3591 7,818
16:04 2150 $1.3100 $1.3700 $2,936.50 $1.3658 0.40% 46.92%
N.B.The low percentage change would be -1.46% if the real low of $1.35 was used instead of the faux low of $1.31 from the suspicious AH trade.__Open_ ___Low_ __High_ _Close_ Volume_
Today 0.73% -4.38% 1.43% -2.17% 300.62%
Prior 0.74% 1.48% 0.00% 0.73% 57.83%
Time for a new minimal chart I guess.
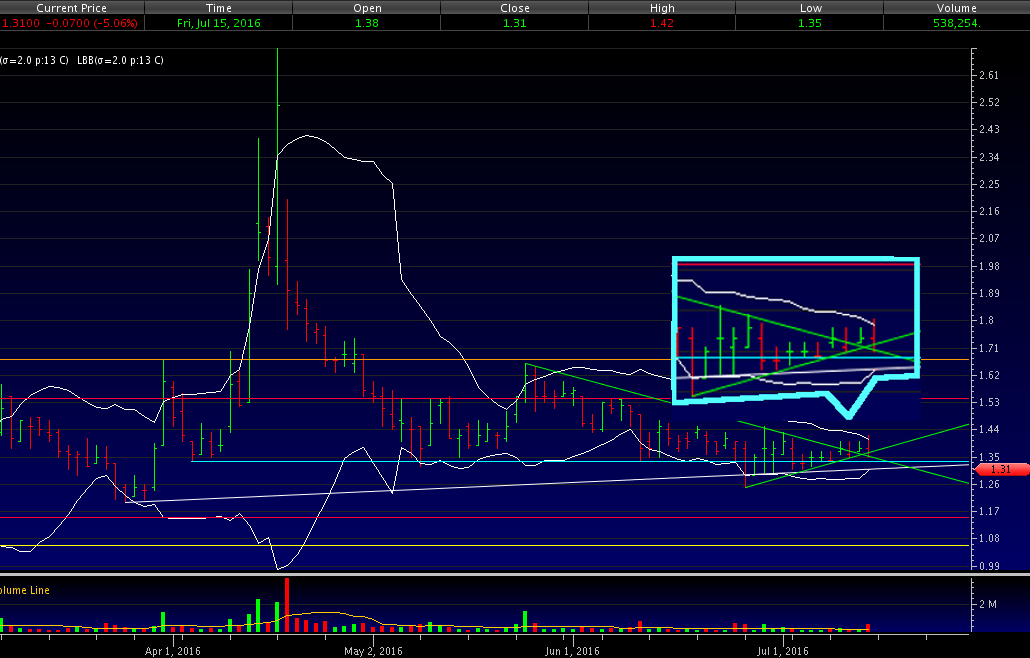
I've included an inset to provide slightly more detail on what the recent prices vs. trend lines look like.
The first thing to note is that the suspicious AH trade at $1.31 is almost invisible sitting right atop the lower Bollinger limit of $1.3074. It also happens to be right on the rising medium-term support which has been tested and held several times in the recent past. It's also below the known strong $1.34 support tested and held many times.
You getting the picture? All this combined with the four cents below the close and six cents below the other AH trade and the b/a at the time being 4K:700 $1.31/8, occurring on a Friday after hours for a crummy 150 shares makes my TFH glow with suspicion that someone is trying to "shake the bushes" here to get weak hands to let go of their shares at cheap(er) prices.
This suspicious activity executed on the Direct Edge X exchange (now merged with the BATS exchange but they still operate distinct exchange codes and present as different platforms) which was founded in NJ and was a staunch advocate of the controversial "flash order" capability. They have in the past also been involved with Knight Capital and Citadel, neither of which present(ed in the case of Knight) any evidence of being more moral than the financial industry as a whole.
I suspect the "shaking the bushes" may not work because I seriously doubt there are any "weak hands" (e.g. skittish long-term retail investors) of any substantial quantity left if the apathetic response to the recent positive PRs are any indication. There could be some short-term traders (e.g. day traders, no momo though because the price has exhibited no "momo"). Regardless, the various platforms will show "last trade" at $1.31 and this may cause palpitations in some less-aware folks and an adrenalin rush in those who are aware and have been looking for a better entry for a trade or investment.
N.B. I will be looking to repeat my recent entry ca. $1.32 on Monday, figuring some few folks will get spooked and release their shares at really cheap prices before the MMs (or shorters if they are attempting covering buys) move price up again.
Anyway, considering the more conventional aspects ...
Note the new short-term rising support (lower rising green line) we have been riding up over the last week or so. Note also that the real close of $1.35 is below both green lines, the rising one at ~$1.365 and the falling one at ~$1.3575 (best I can tell - my lines and eyes have the same affliction, imprecision). If tomorrow we close below (estimated!) $1.375 for the rising green line (short-term support) or ~$1.35 for the descending green line, that will be a confirmed break down from those respective support lines.
However, we could still be above both the well-tested $1.34 price-point support and the rising long-term support (rising white line), ~$1.31. I consider these two more reliable trends than the medium and short-term green lines.
I do not expect these breaks down to happen for reasons of both conventional TA and TFH suspicions. First, the volume being up 300%+ (i.e, 400% yesterday's) suggests a flush occurred. Folks "flushing" at $1.40+ likely exhausted sellers at this level and if they are traders they are likely to become buyers (especially if "they" are the ones that planted the $1.31 flag). Further, the volume was well up from yesterdays 10-day moving average of ~166K (IOW, ~3.2 times the average). Second, our real close was above the known strong support at $1.34 even though we had high volume and a marginally weaker VWAP. Note though that today's VWAP of ~$1.38 was well above that support and the close, and has been for six (seven if we include 7/7's $1.3476) consecutive days now.
Last, Bulkowski's break apparently will not occur, in either direction, as we essentially just sidled out of the triangle. That leaves us strongly still in consolidation and in that situation the trends tend to hold more strongly than when not in that condition. As some evidence of this, check my table at the bottom for minimum prices down in the low $1.3x area vs. the corresponding VWAPs and following days' behavior.
My TFH knows that MMs work on a combination of VWAP and volume to generate their incomes. It suspects they will work towards achieving intra-day movement of $1.34->$1.38 (or higher?) range as a starting point in tomorrow's early trading, especially if the $1.31 has the desired effect of getting stops triggered or any remaining "weak hands" to dump. Shorters would love this as they could do more covering buys at very attractive prices, locking in further profits. Both situations argue for a slowly, at least, improving intra-day price range as shorters try to stealthily do their covering buys and MMs do the same for the naked shorting they did today if the semi-typical early drop and then bounce occurs.
Finally, off the charts, there's no reason to think that the recent PRs should have a negative effect on market sentiment. If total apathy has not taken control there should be sufficient positive sentiment residual regarding the results expected in the reporting, likely first week of August, to hold in the mid-$1.3x and above level. Progress in expense reduction should be starting to appear, it's effects on margin should start to appear and DJ will focus on the ESCO PRs we've seen and likely have a few more positives that occurred after close of FQ1 (Calender Q2).
We also know the ATM can't be utilized until September (when, coincidentally, there's another presentation scheduled to "mine the street"). We also have the warrant holders lurking in the background who likely want to see at least $2.25 (their strike price) and above so they can short/sell into the market with impunity.
On my one-year chart the 20-day SMA continued declining and the 10-day went from yesterday's predicted one-day flat to again declining. The 50-day, which yesterday got a very small up-tick, will see no more unless range can progress to around the $1.45 area. If we hold here we have the 20-day declining for at least four more days and the 10-day will get another up-tick for one or two days before beginning another decline.
I do not expect we'll just hold flat though.
The oscillators I watch, which yesterday essentially continued the prior day's behavior with RSI and full stochastic improve while momentum, Williams %R, ADX-related and MFI (untrusted by me) all weakened, saw weakening in every oscillator and had Williams %R enter oversold while the rest moved below neutral, but for accumulation which was already there and just went further down.
The 13-period Bollinger limits, $1.3074 and $1.4080 ($1.2802 and $1.4260 yesterday) continued converging with the mid-point now rising more rapidly as the lower limit rises more quickly than the upper limit falls. As mentioned, a "pinch" condition is rapidly approaching. Ignoring the spurious AH $1.31 trade, we are trading at and above the mid-point, a good sign I think.
All in, only the rising Bollinger mid-point and volume spike suggest not much likelihood of substantial down movement. I do believe we'll see early weakness, due to the manipulative AH trade that was entered, but should recover during the day to somewhere around that $1.35, or better, level.
Restricting myself to just the TA though I would say best case scenario, near-term, is continued consolidation with some mild weakness.

Percentages for daily short sales and buys moved in opposite directions, but the short percentage remains just above the lower end of my desired range (needs re-check) and the buy percentage moved back up to what is normal for us, but still not sufficient for sustained appreciation. These two, in aggregate, I think suggest less risk of sustained downside even though they went opposite directions. The reduction in short percentage could be an artifact of increased inter/intra-broker trades during the high-volume pop and subsequent decline described above. Momo and day traders might effectively be trading shares held (or even owned) by their brokers, and already settled, and these would generate no short flags.
The spread looks much too large until you discount that suspicious trade and use the official $1.35 low, giving a spread of 5.19%. That's still a bit larger than would be expected during consolidation, but considering the pop to $1.42 and relatively very high volume it's not really concerning, especially since we are not within a defined down trend.
The VWAP's last twenty-four readings went a bit more positive at ten negatives and fourteen positives. Change since 06/10 is -$0.0130, -0.93%. If our trading range stays where it's at (I hope not!) we'll continue to see small percentage until we have 6/20 as our basis. Our average of percentage changes over this period is -0.0047%.
All in, there's nothing strongly suggestive of a near-term bias either way here. But there's good suggestions that we aren't facing a near-term big move lower - low but normal short percentage, normal buy percentage (especially in conjunction with a higher "unknown" giving a lower "sell"), reasonable spread (excluding the faux flag), smaller negative variations in the VWAP over an extended period.
The big volume increase could be a negative suggestion but it's large enough (highest since 6/27's ~558K that was followed by two days of higher VWAP) that it could signal a "flush" had occurred and sellers could be exhausted at this price level.
That might be the reason for the $1.31 AH trade - try to move price down to flush some more folks out of their positions.
Based on this unconventional stuff, I'm holding at "consolidation" and I think the "mild bullish bias" might return here.
As always, much is experimental and should be treated as such.
Bill
Join the InvestorsHub Community
Register for free to join our community of investors and share your ideas. You will also get access to streaming quotes, interactive charts, trades, portfolio, live options flow and more tools.

