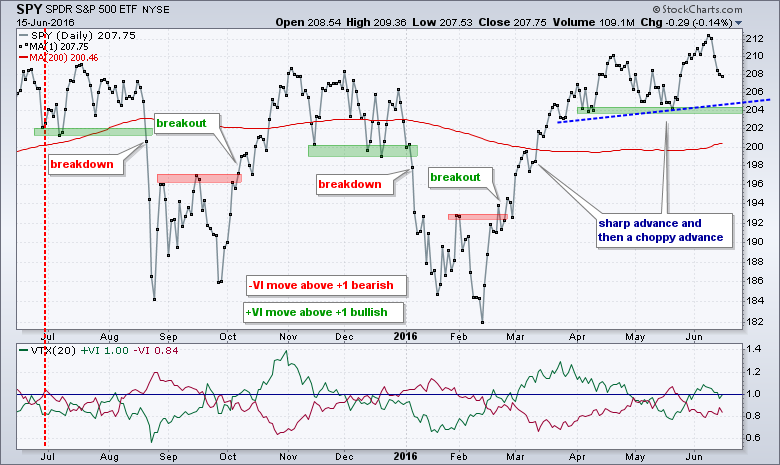
The S&P 500 SPDR (SPY) chart shows a sharp advance from mid February to late March and then a choppy advance since early April. The April-May lows mark a clear support zone in the 204 area and these lows hold the key to the medium-term uptrend. In theory, SPY could pullback to the 205-206 area and still be within the confines of a choppy uptrend.
The indicator window shows the Vortex brothers (+VI and -VI). These indicators compare highs and lows, and use the Average True Range (ATR) to measure positive trend and negative trend. I am using 20 days because this represents a month. The pair has a bullish bias when +VI (green) crosses above -VI (red) and a bearish bias when -VI crosses below +VI. There can be quite a few crosses so I also look for a cross above 1 to confirm any signal. A bullish signal triggered in mid February, a bearish signal in mid May and a bullish signal in early June. This indicator is not immune to whipsaws and will remain on a bullish signal until -VI moves above +VI and exceeds 1.
Register for free to join our community of investors and share your ideas. You will also get access to streaming quotes, interactive charts, trades, portfolio, live options flow and more tools.
 News
News  Market Data
  Discover