


Friday, May 20, 2016 7:19:03 AM
Tomorrow is Friday, often low-volume and flattish. Nothing here inspires me to argue with that.
What a change from the last few days. Disregarding price, buy percentage started less strongly, ~52% at 10:00, and went quickly downhill, hitting ~18% at 10:30 and rebounding only to ~28.8% by 11:30. Subsequently the best it achieved was 35.74% at 14:00 and it deteriorated through 15:30, hitting ~26% and recovered only to ~33% at the close. All this was on minuscule volume.
Speaking of closes, it was only a penny above 15:59's end. The crew must have been out for a three-martini lunch today.
Now adding in the price, it was open low, 2 cents below yesterday's close which I termed a phony close, and started going down, on very low/no-volume, to bottom the first time at $1.38 at 10:32. A pitiful recovery to $1.39/$1.40 was followed by a long very low/no-volume period there. Finally 11:53 got a ~5K $1.39->$1.41 done and we saw a mostly very low/no-volume $1.39-$1.41, with some one or few minute small excursion in price or volume, and ended the day there but for the $1.42 closing trade being up a penny.
Over all, not a bullish looking intra-day profile.
There were no pre-market trades.
09:30-10:35 opened the day with a 1,521 sell for $1.42, and began an extended weakening on 9:31's 360 $1.4260, 9:32-:54's no trades, 9:55's ~1.2K $1.4249, 9:57-:58's 200 $1.42, 9:59's 1.2K $1.41 (new intra-day low & b/a imbalance goes to 10.4K:600 $1.40/1), 10:00-:07's no trades, 10:08's ~3K $1.41, 10:09's 200 $1.4080, 10:15's ~1.5K $1.4050/$1.4070, 10:17's 1.1K $1.40/$1.4050, 10:19-:21's ~10.9K $1.40 (b/a became ~20.6K:200 $1.38/9), 10:28's 100 $1.40, 10:32's 352 $1.39->$1.3801 (b/a went ~29K:1.1K $1.38/40), and 10:35's 1K $1.3827 ended the period.
10:36-11:06 began flat and then did a small climb up. First was 10:36's 4.2K $1.39/$1.3984, followed by 10:37's 725 $$1.39/$1.3995, 10:39's 200 $1.39, 10:41's 8K $1.38/$1.3801, 10:48's 400 $1.39, 10:55-:56's 200 $1.39, 11:02-:03's 300 $1.39/$1.3950, and 11:06's 200 $1.40 ended the period.
11:07-11:52 began a very low/no-volume (e.g 11:07-:17's no trades) $1.39/40 with b/a ~11.1K:~1.9K $1.39/40 at 11:30. The period ended on 11:52's 100 $1.39.
11:53-12:30 began a very low/no-volume $1.40/1, with again a substantial b/a buy imbalance, after 11:53's ~5K $1.39->$1.41. 12:30's ~2.3K $1.40 ended the period.
12:31-14:06, after two no-trades minutes, began very low/no-volume $1.39/$1.41 when it did 12:33's 179 $1.39, giving a b/a 14K:3.2K $1.39/41. The period price range was interrupted by 13:21's 200 1.41/3. 14:06's 564 $1.41 ended the period.
14:07-15:10, after two no-trades minutes, began a very low/no-volume $1.39/$1.40 with 14:09's 3K $1.39/$1.40. Volume and/or price profile was interrupted by 14:14's 5.1K $1.39, 14:41's ~8.5K $1.39/40, 14:51's 3K $1.39 and 14:52's 12.9K $1.39/41. 15:10's 300 $1.40 ended the period.
15:11-16:00, after a no-trades minutes, began low/no-volume $1.40/1 on 15:12's 200 $1.42 and ended the period and day on 15:59's 634 $1.40/1 and 16:00's 470 buy for $1.42.
There were no AH trades.
Excluding the opening and closing trades (didn't qualify), there were 2 larger trades (>=5K & 1 4K+) totaling 9,855, 7.49% of day's volume, with a $1.4069 VWAP. Even considering today's low volume, the number of larger trades and percentage of day's volume is extraordinarily low. Further, these were likely retail trades because the VWAP is relatively quite a bit above the day's VWAP. As with yesterday, this can't be a good sign.
On the traditional TA front, movements were:Ending Period Period Period __Per. Trade_ Period_ % Day_ Per. End
Period Volume Low High _Dollar Val._ VWAP___ Volume Buy ~%
10:35 22279 $1.3801 $1.4260 $31,276.83 $1.4039 16.94% 21.74%
11:06 17225 $1.3800 $1.4000 $23,924.34 $1.3889 13.10% 28.96%
11:52 7900 $1.3900 $1.4000 $11,012.86 $1.3940 6.01% 31.16%
12:30 11072 $1.3900 $1.4120 $15,531.73 $1.4028 8.42% 33.74%
14:06 7626 $1.3900 $1.4300 $10,711.35 $1.4046 5.80% 34.38%
15:10 39775 $1.3900 $1.4100 $55,490.18 $1.3951 30.24% 27.44% Incl 14:14 $1.3900 4,300
16:00 23945 $1.3900 $1.4200 $33,692.96 $1.4071 18.20% 32.88% Incl 15:58 $1.4200 5,555
On my minimal chart yesterday I said { ... So I'm leaning even more to thinking tomorrow we don't confirm a break above the support/resistance. }. Today we again closed below the rising support/resistance (lower rising orange line) and today didn't even touch it at the day's high. The last five days are making a rounding, and now falling, highs and lows pattern on declining volume the last two days. That volume pattern is the only good thing in that it says there's not a lot of strength (yet!) in the move lower.__Open_ ___Low_ __High_ _Close_ Volume_
Today 1.43% -1.43% -2.05% -1.39% -34.06%
Prior 0.72% 0.72% -0.68% 1.41% -14.99%
We've got a "southern doji" candlestick (open and close same price with a long tail at the in (at end of?) a down trend) which is supposed to be a bullish reversal sign. Bulkowski finds it's random, actually reversing only 52% of the time. Even if it does reverse it's a poor performer not meeting price target all that often unless it occurs in a bull market with an upward breakout.
On my one-year chart the 10-day SMA is falling instead of flattening because our range dropped. The 20-day SMA continues to decline and will do so for a couple weeks if we don't pop up quickly. Worse, it's decline is likely to accelerate if we don't. The 50-day remains almost flat and will continue that way, with small perturbations, for a couple weeks if we hold our price range. As said yesterday though, price range is very likely to move.
The oscillators I watch got more mixed with marginal improvement in accumulation/distribution, MFI (untrusted by me), momentum, and full stochastic. MFI and momentum are slightly above neutral. Marginal weakening occurred in RSI, Williams %R and ADX-related. All are below neutral.
I noted yesterday my longer-term descending resistance is was right atop our price range and didn't know if it was a strong resistance or not. Looks today like we had our first recent new test and it held. As I mentioned, ignoring Friday, another day or two should tell. Right now it's not looking good as even the semi-normal close several pennies above the last trades of 15:59 didn't occur and we closed below the line.
The 13-period Bollinger limits, $1.3583 and $1.5232 ($1.3511 and $1.5504 yesterday) are still converging and the mid-point is dropping. The top of our trading range is right around the mid-point so there's no suggestion of a direction if the break suggested by the converging limits appears.
All in, I don't see much, other than low volume, offering hope of a near-term move up.
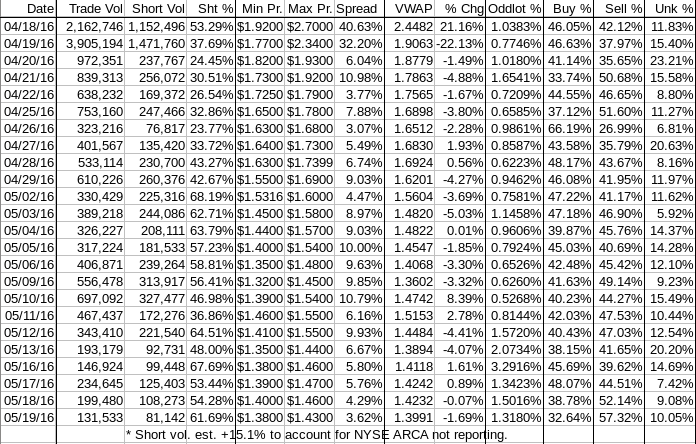
Percentages for daily short sales and buys moved in opposite directions again and both moved further from the desired ranges. The drop in buy percentage over the last four days is substantial and seem to match the rounding highs and lows pattern noted above.
The spread is finally in a completely normal range so even being in a short-term down-trend it doesn't give us a big clue about what's likely. The intra-day action that produced it does however.
VWAP movement now has fifteen negative and six positives in the last twenty-one readings. The movement yesterday was small enough though to be really considered flat.
All in, tomorrow being Friday, I'm suspecting little change. Continued low volume and some price weakness seems most likely because nothing in my unconventional TA suggests positive. The narrowed spread does however project less negative.
Yippee. :-\
As always, much is experimental and should be treated as such.
Bill
Join the InvestorsHub Community
Register for free to join our community of investors and share your ideas. You will also get access to streaming quotes, interactive charts, trades, portfolio, live options flow and more tools.

