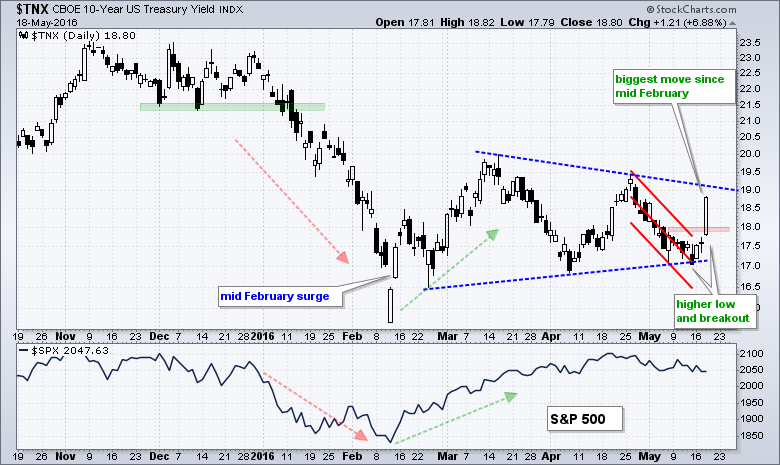
I featured charts of the 10-YR Treasury Yield ($TNX), Finance SPDR, Regional Bank SPDR and Broker-Dealer iShares on Tuesday. These were shown together because I thought the 10-yr yield was at its moment-of-truth. Well, $TNX made a big statement yesterday with its biggest move since mid February. This also happens to be when the S&P 500 bottomed and began a strong run. The short-term breakout in the 10-yr yield is positive for stocks because stocks are positively correlated to the 10-yr yield (and negatively correlated to the 7-10 YR T-Bond ETF). It also means that money is moving out of safe-haven bonds and this money may find its way into riskier assets, such as stocks. Note that utilities, consumer staples and REITs often underperform when the 10-yr yield rises.
Register for free to join our community of investors and share your ideas. You will also get access to streaming quotes, interactive charts, trades, portfolio, live options flow and more tools.
 News
News  Market Data
  Discover